Thapar University 2006 B.E Mechanical Engineering Inspection
Thapar Institute Of Engineering & Technology, Patiala
End Semester Examination, 2006
Inspection & Quality Control (ME 017)
&
THAPAR INSTITUTE OF ENGINEERING & TECHNOLOGY END SEMESTER EXAMINATION (DECEMBER 11,2006)
B.E. Final Year Mechanical Engineering ME-017 Inspection & Quality Control Time Allowed: 3 Hours Max. Marks: 90
NOTE: i) Attempt any five questions. ii) Attempt all parts of a question at one place, iii) Graph paper can be asked for. iv) Assume missing data, if any suitably, v) Use of SQC tables is permitted.
Q.1 (a) Draw and explain organization chart for a typical Process Industry?
(3)
(3)
(3)
(3)
(4)
(2)
(4)
(4)
(10)
(b) Distinguish between Natural Tolerance Limits and Specification Limits.
(c) Using suitable example depict the production-inspection interactions and problems?
(d) Explain spiral of progress in quality?
(e) Improving the quality of design is associated with higher cost while improving the quality of conformance is associated with lower cost briefly discuss.
(0 Explain appraisal cost?
Q.2(a) What arc the conditions under which control charts for individual and moving ranges are used? Also write the control limits for these charts.
(b) Explain the trends and shifts in the process level; also write the reasons behind these non-random patterns?
(c) The bore size on a component to be used in assembly is a critical dimension. Samples of size 4 are collected and the sample average diameter and range are calculated. After 25 such samples, we have: .
fY, =107.5. /f = 12.5 1-1 >-l The specifications on the bore size are 4.4 0.2mm. The unit cost of scrap and rework arc S2.40 and $0.75 respectively. The daily production rate is 1200.
(i) Find the trial control limits for X and R - charts.
(ii) Assuming the process in control, estimate Cp.
(iii) Find the total daily cost of scrap and re-work.
(iv)If the process average shifts to 4.5mm, what is the impact on the proportion of scrap and re-work produced?
Q.3(a) What are the advantages and disadvantages of the standardized p-chart as (4) compared to regular proportion non-conforming chart?
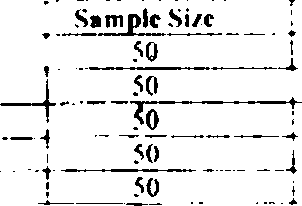
(b) The number of non-conforming items obtained from 20 random samples are shown (14) in the table, the corresponding sample size is also indicated, construct a standardized p-chart and discuss your inferences. t
|
Sample j Items Inspected |
Non-conforming Items |
Sample |
Items Inspected |
Non-conforming Items | |
|
1 |
50 |
4 |
11 |
80 |
6 |
|
2 |
90 |
6 |
12 |
120 |
8 |
|
3 |
100 |
8 |
13 |
100 |
20 |
|
4 |
90 |
7 |
14 |
80 |
5 |
|
5. |
80 |
8 |
15 |
110 |
8 |
|
6 |
40 |
4 |
16 |
40 |
6 |
|
7 |
50 |
6 |
17 |
40 |
4 |
|
8 |
50 |
5 |
18 |
50 |
7 |
|
9 |
110 |
8 |
19 |
120 |
5 |
|
10 |
70 |
6 |
20 |
50 |
4 |
Q.4(a) Distinguish between the producers risk and consumer's risk and explain the terms (4) acceptable quality level and limiting quality level in this context.
(b) For the following two sampling plans, calculatc the average total inspection for 2% (6) and 4% defective lots and comment on the results:
Plan-I N = 1000, n=100. c=l Plan-11 N = 1500, n=150, c=2
(c) Design a single sampling plan that will reject the lots that arc 1.3% nonconforming (8) 8% of the times. Use acceptance numbers of 1. 3 and 5. From a consumers point of view, which of these three plans vsould you choose and why?
(18)
Q.5 A multiple sampling plan is as under:
|
I Sampjc Number - |  |
|
Acceptance Number |
Rejection Number |
|
3 | |
|
1 |
* 3 |
|
> |
4 |
|
3 |
5 |
|
5 |
6 |
l ind the probability of acceptance of 1.5% defective lot. Assume the lot size to be large in comparison to the sample size. Also calculate the probability of rejection in each sample.
Q.6(a) In ihe acceptance sampling under ANSI ASQC 21.4 standard, single sample is to (4) be used with inspection lev el-11. an AQi. of 4% and a lot size of 2500. What are the acceptance criteria under ti) Normal Inspection
(ii) Reduced Inspection
(iii) lightened Inspection
{b> Discuss the basis on which Dodge-Roming plans are formulated, and the main (3) objective of these plans? r
i c) 1 xplain the effect of sample si/e and acceptance number on shape of OC curve and (3) protection offered by the sampling plan.
(d) Construct the operating characteristic curve for the following sampling plan : (8)
N 1200. n 50, c 1. if acceptable quality level is 0.5% nonconforming and limiting quality level is 8.5% nonconforming, describe the protection offered by the plan at these quality levels.
Also construct the average outgoing quality curve for the same plan and find out
AOQL
Q.7(a) Kxplain the mam processes which are necessary for structural implementation of (6) total quality program in an industrial organization, proposed by Juran.
(b) Kxplain the principle objectives of TQM. (3)
(c) Describe the lile-cycle of a product What probability distribution would you use (4)
lo model each phase?
(d) I*xplain Sequential Reliability Testing. (5)
|
Attachment: |
| Earning: Approval pending. |
