Maharashi Dayanand University (MDU) 2010-2nd Year B.Tech Electronics and Tele-Communication Engineering Communication Engineering from University of year - Question Paper
B.E.
Fifth Semester Examination, 2009-2010
Download Communication Engineering (EE-301-E) from MDU University with complete verified solutions. Even if you are not from MDU then too the students of Electronics and Communication Engineering will obtain this ques. paper useful.
Fifth Semester Examination, 2009-2010 Communication Engineering (EE-301-E)
Note : Attempt any five questions. All questions carry Lqual marks
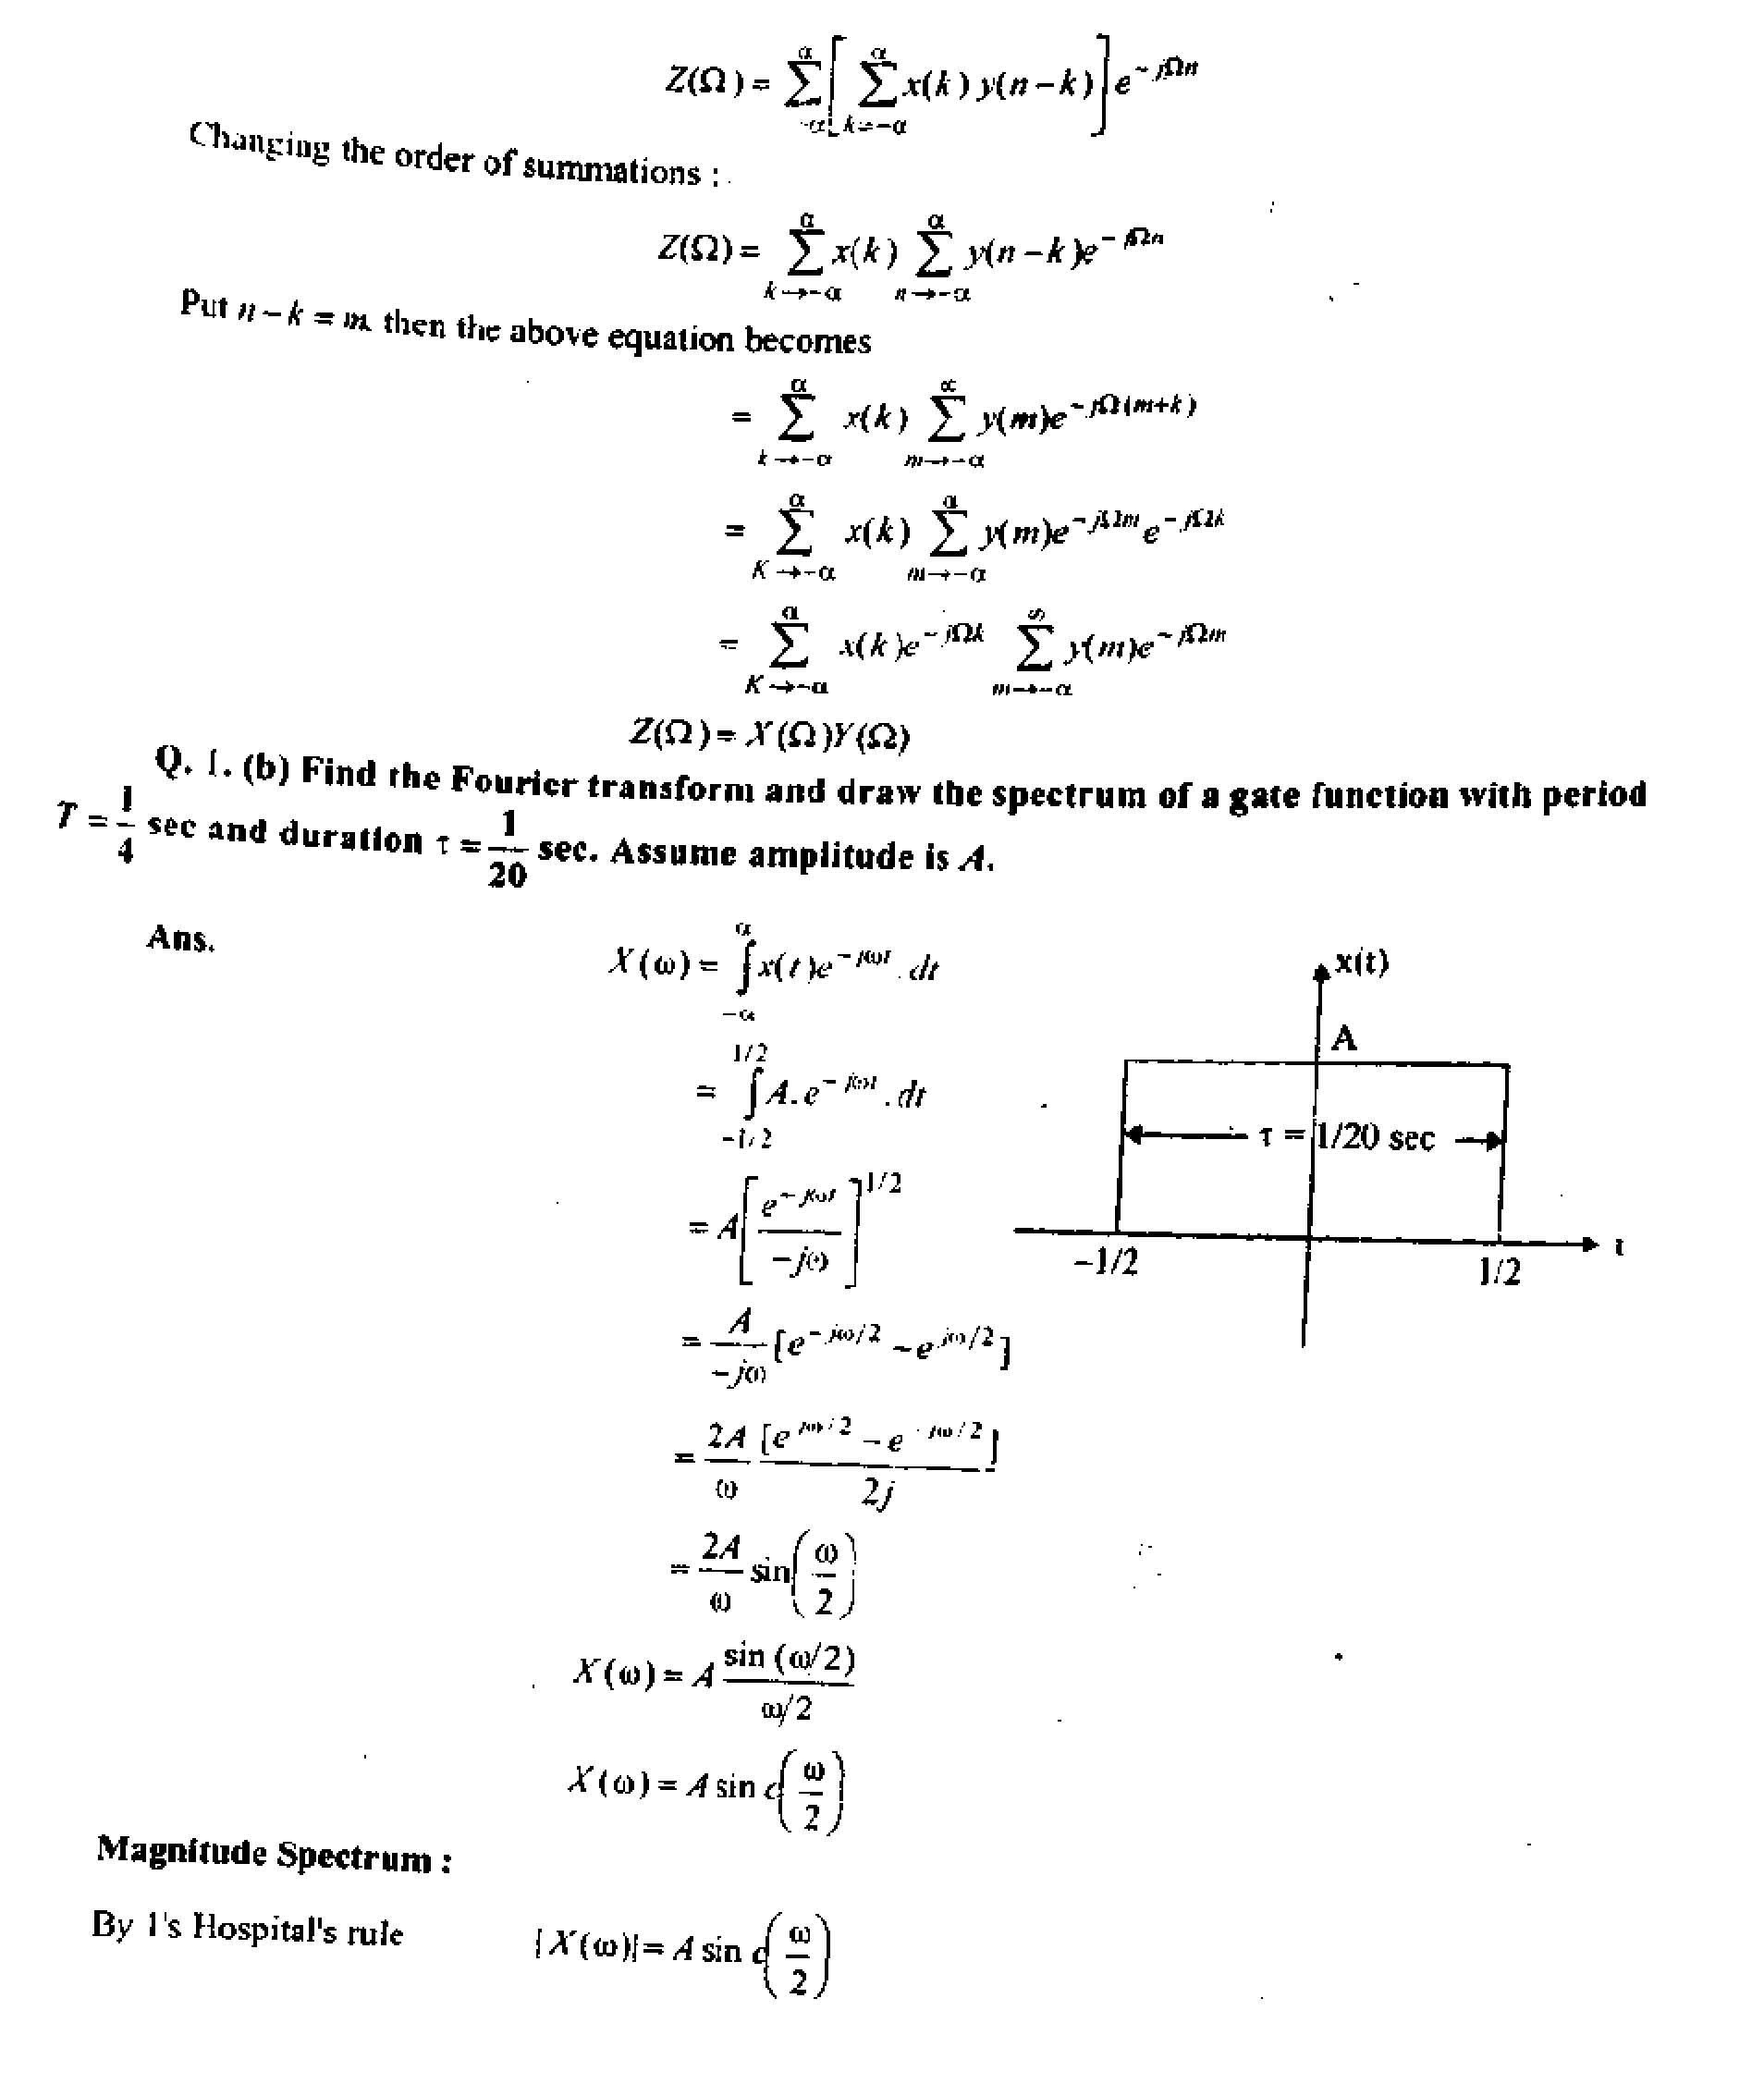
Q. I. (a) Explain and prove convolution theorem in frequency domain and time domain. Atis, Convolution in Time Domain :
If .*(/)-- -V(w), then
z(/)= v(f )**0A"((d) I (<u)
Z(<o)=
Proof:
"*L
*7
-o
= j ~z)th]e~ .(h
(h
Pul / t q, thenr = x+a
dt = da, limits will remain same
Z4<)= j.vlr)
-a
a
- J4--
Jv<a)i?',wlr+U,.(fa
J
a
Jj(oty ***.#-> //y
.(It
dr
(fu
Convolution in Frequency Domain :
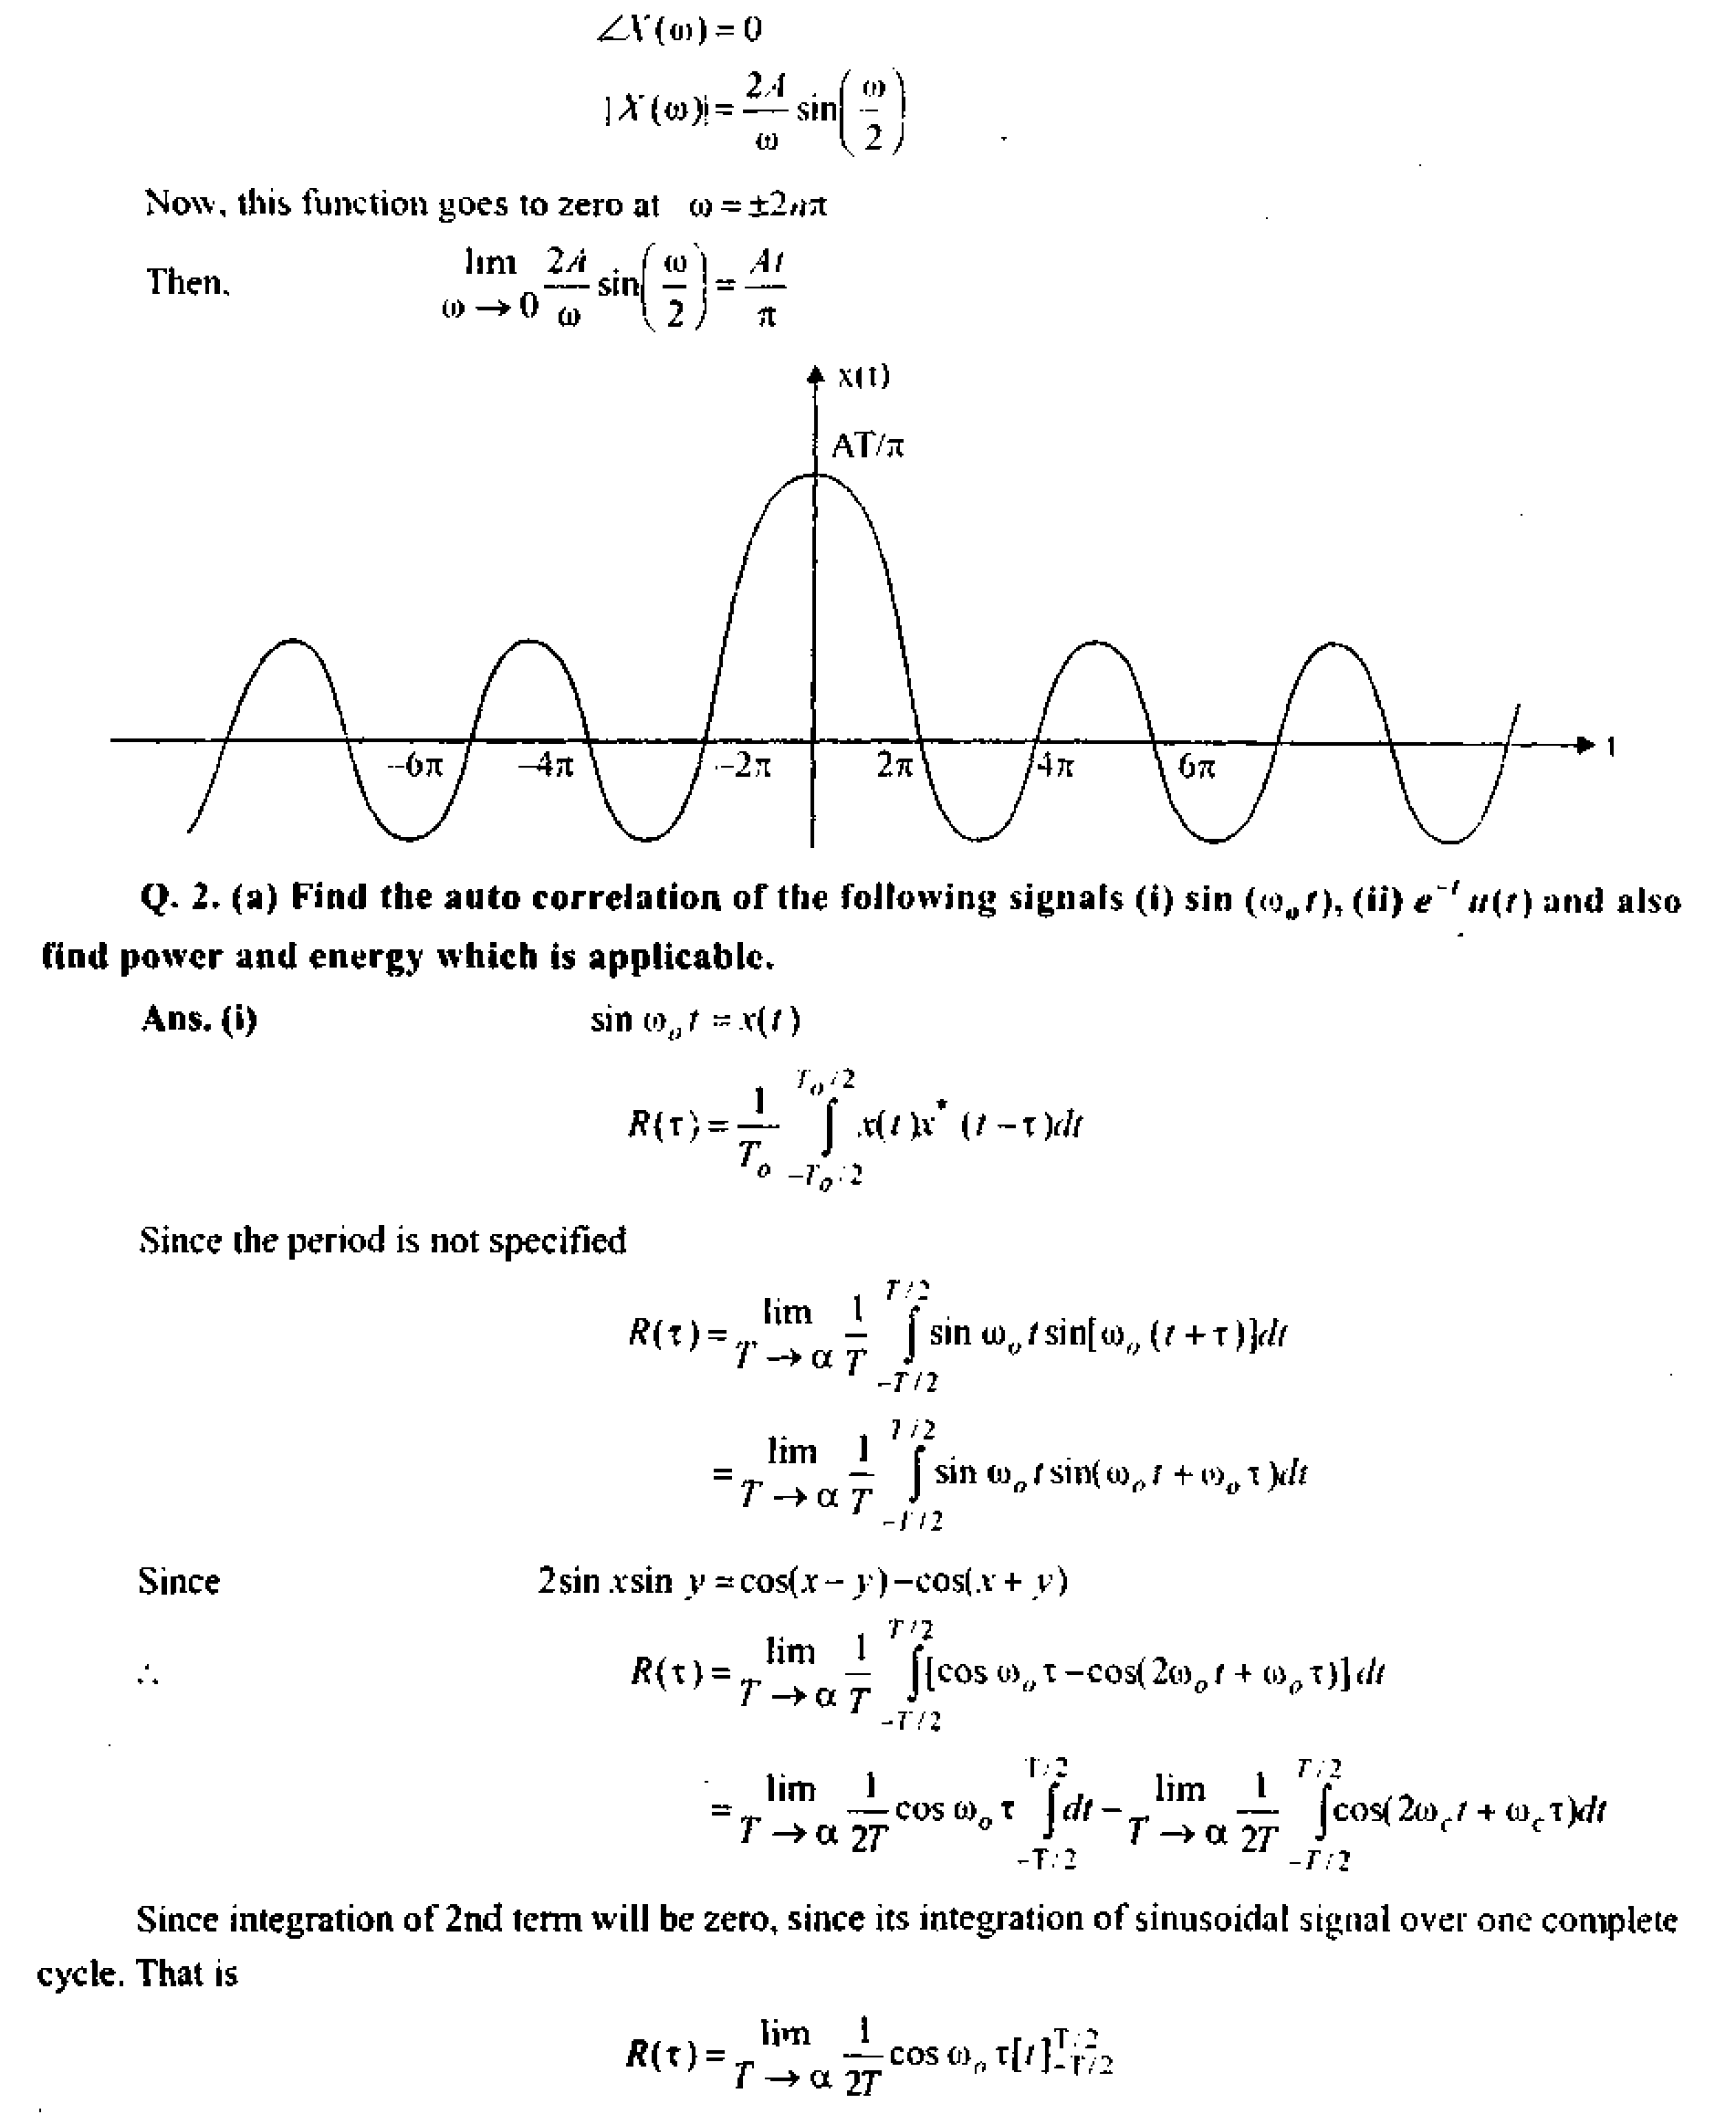
Hence energy is finite and non-zero, hence it is a energy signal.
Q. 2. (b) State and prove Parseval's theorem for power signals.
Ans. The theorem defines the power of a signal is terms of its fourier series coefficients, i.e., in terms of amplitudes of the harmonic components present in the signal. *
Let us consider a function f(t ]L we know that
Where /* (r) is a complex conjugate of the function /(/) The power of the signal /(/) over a cycle is given by
. 772 < T/2
* _T-/ * _T
-T'2
-77 2
Replacing fit)by its exponential Fourier series
, 772
dt
-77 2
Interchanging the order of integration and summation
T/2
-mx -772
The integral in the above expression is equal to TF*.
/>= YfnK
Hence, we may write
-*-a
This is Parseval's power theorem.
Q, 3. (a) A random process provides measurements x between the values 0 and 1 with a probability density function (PDF) given as :
fx (*) =12xs -21*1 +10* for 0<Jxl = 0 otherwise
(ii) Obtain number k such that P\X A]=
/(.t) = 12v3 -2U2 + lftr for 0*sl -0 otherwise
= jf(u)du
But for .vSO, /((/) = 0
X
P =
= 0
* \f{u)du
i
2
VI
1
V2
4 " 3 + 2
_fl2 21 10 12x(V2)J 2KV2)3 lG(l/2): =[T'T + T 4 3 + 2 14 3 + 2 64 24 + ~8 J
_21_2ll ~ 24 ~ J J
192+320-12 + 80
64
[
J5S0 189] 1.64 24 J
580 (21 + 168)1 64 24 J
= [9.06-7.875] = L185
(ii) P[X<k] =
1
-a
12m*1 21hj 10m2
4 3 + 2
3Jt4 -7Jt3-5A2 = -2
k2(ik2 7Jt 5) =
Q. 3. (b) Define cumulative function. Explain different properties of cumulative distribution function.
Ans. The cumulative distribution function fot a discrete random variable is defined as F(X) = P(X *)=/(h) -a <x<tc
nit
If A" can take on the values*,, x2, x}..........xa, then the distribution function is given by
0, -a<;*<X|
/(*,), *, x<x2
/<*) =
f(x, )+/{x2 ), X2 i.v <.r3
f(X\ )+/U:)+......f{x ),x <V<00
The cumulative distribution function for a continuous random variable is defined as:
F(x) = P(X <X <*}
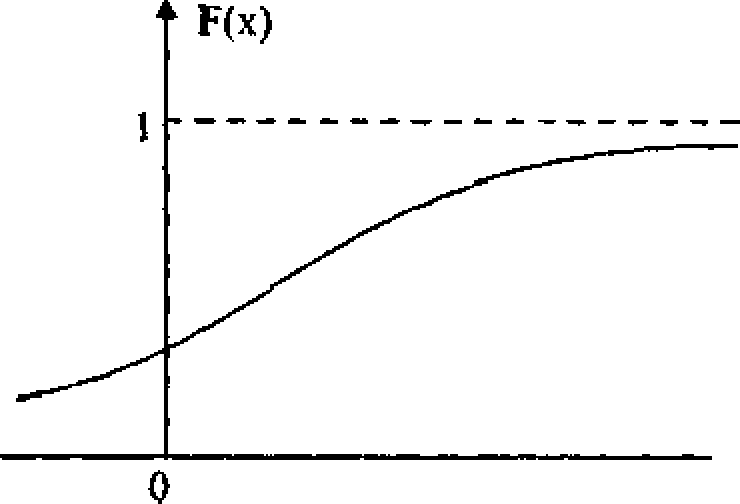
At the points of continuity of f(x\ the sign can be replaced by the sign <. The plots of /(*) & F(x) are shown as :
 |
*- x |
|
(b) Distribution function of continuous random variable | |
|
i |
1 f(x) | |||
|
f | ||||
|
0 a |
) | |||
(a) PDF of continuous random variable
Since f[x)> Q the curve in figure (a) cannot fall below ,T-axis. The total area under the curve in figure (a) must be 1, and the shaded area in it gives the probability that x lies between a & b i.e.. P(a <x<h \ The distribution function F{x) is a monoticaUy increasing function that increases from 0 io
I as shown in figure (b).
Q. 4. (a) Why Is Gaussian distribution is most widely used? Explain.
Ans. Gaussian Distribution : This is the most important continuous probability distribution as most of the natural phenomenon are characterized by random variables with normal distribution. The
importance of normal distribution is further enhanced because of central limit theorem. The density
function for Gaussian distribution is given by
/(*) = -
-a <x<a
Where. |.i & a are mean and standard deviation, respectively. The properties of normal
distribution are '
mean = n & variance = o*
The corresponding distribution function is
jt)=1=
rfv
< =____
cr-s/2jt
j-n
Let Z be the standardized random variable corresponding toX. Thus, if Z =, then the mean of
a
Z is zero and it? variance is 1, Hence,
42k
/(: )is known as standard normal density function. The corresponding distribution function is :
F(z) = P(z<z) = ~ jef2du
du
The integral is not easily evaluated. However, it is related to the error function, whose tabulated
values are available in mathematical tables. The error function of z is defined as
2 K-2
eifz=~ie~u du
The error function has values between 0 and 1
erf( 0) = 0, &etf(a) = \
The complementary error function of z is defined as
etfc(z) = t-eif(z)
= pr I e du vit;
The relationship between F(z), erf(z) &, erfc{z) is as follows :
|
The graph of f(z) is known as standard normal curve is shown as : | ||||||||||||||||||||||||||||||||||||
|
' 68.27% '
*-M
95.45%
99.73%
(Standard normal curve)
Q. 4. (b) Prove that the mean and variance of a random variable X having an uniform
(a~b)2
distribution in the interval |a, A] are mx =
=-
Ans. A random variable x is said to have a uniform distribution in the region a<x<bif its density
function is
1
b - a 1

0 ohterwise
A uniform distribution is shown as The properties are
mean = -(a+ 6) 2
-+x
a b
Uniform distribution
Variance
Q, 5. (a) Define ergodic process. Explain the difference between ergodic process and stationary process.
Ans. To determine the statistics of the room temperature, say mean value, we may follow one of the following two procedures :
(i) We may fix t to some value, say t. The result is called, random variable
X(t\ ,S ) = X(rt )=[A]A2......Am \ The mean value of ), [A'(r, )J. can now be calculated. It is
known as ensemble average. It may be noted that ensemble average is a function of time. There is an ensemble average corresponding to each time. Thus, at time t2, we have
J((t2,S) = X(t2) = [BuB2.......Bm]
The ensemble average corresponding to time =E[X(ti)], can also be found out. Similarly, ensemble average corresponding to any time can be found out.
' (iij We may consider a sample function, say .v, (;) over the entire time scale. Then the mean value of t| {/) is defined us
| ||||||||||||||||||||
|
A random process |
Similarly, we can find mean values of other sample functions. The expected value of all mean values is known as time average and is given as
A random process for which mean values of all sample functions are same is known as a regular random process.
In tins ease <.v( (f )>=<*i(f) >=........=<x(r }> = <*(/) >
For some process, ensembles average is independent to time, i.e.,
t*(fi)] = [*(/2)]=........=[*</)]
Such processes arc known as stationery processes in restricted sense. If all the statistical pi open lcs of a random process are independent 10 time, then it is known as stationary process in strict sense When we say stationary process, then it is meant that the process is stationary in strict sense.
When an ensembled average is equal to the time average, then the process is known as ergodic process in restricted sense. When all the statistical ensemble properties are equal to statistical time properties, then the process is known as ergodic process in strict sense. When we say ergodic process, then it is meant that the process is ergodic in strict sense. It may be noted that ergodic process is a subset of a stationary process, i.e., if a process is ergodic, then it is also stationary, but the vice-versa is not necessarily true.
Q. 5. (b) Calculate the moments m,, m2 and S1 for (i) Binomial distribution (ii) Gaussian distribution (iii) Kavleigh distribution.
Ans. The r'h moment of a random variable labour the origin is defined as
The r,h moment of a random variable X about the mean p. is defined as
Hr=EUX-nn, r = 0,1, 2 M r 15 also known as r'*1 central moment.
It can be seen that Mo = 1- Mi =mean=n
Ho =1. n, =0, *i2 =V or(A')
In Discrete Case : i.e., for binomial distribution
m .
& Hr
m
From binomial expansion, we have
<*-M>r=y(-l)'Mf"V"V"' n,=u*-nn
Hence
jw=o
-d)
For Continuous Case : i.e., for Gaussian distribution
K = \xr f(x)dx
"Ct
a
&
Moment Generating Function & Characteristic Function: The moment generating function of a random variable X is defined as : '
M(t) = E[e*x]
t X
iX * (A
e = l + tt +-+ .
2!
M{t) = E[ex]
Now,
ml
tmXm . +-+ .
= \ + tE(X )+ E(X2)+......->+.
2!
, , t , t Wm
*1 + #M. + U 2 +........+
1 2! 2 ml
Differentiating about equation w.r.t. Y and then putting t = ft we get Similarly differentiating m times w.r.t. t and then putting r = Qwe get
dt'
Moments about origin can be found out from the moment generating function by using the above equation. The movements about mean can then be found by using equation (i).
The characteristic function of a random variable X is defined as
By expanding this equation, as in the case of a moment generating function, it can be shown that:
(#0
Q. 6. (a) Wfaat it mutual information? How fs it related to channel capacity?
Ans. Mutual Information : The state of knowledge at the receiver about the transmitted symbol v; is the probability that Xj would be selected for transmission. This is a priori probability P(xt). After the reception and selection of the symbol yt, the state of knowledge concerning xt is the conditional probability P{xt j yk ) which is also known as a posteriori probability. Thus, before yk is received, the uncertainly is -log P(.v; >
After >'A- is received, the uncertainty becomes
-logP{x}fyK )
The information gained about by the reception of yt is the net reduction in its uncertainty, and is known as mutual information /(.*,, yk ). Thus,
l(xt, yk ) = Initial uncertainty-Final uncertainty
log Pix , jyk )
= log P(xj )-[log P(Xy/>>*))
)
log/*(.> yk ) \os,P{yk}xj ) P(Xj )p(yt) " p{yk) Thus, we see that mutual information is symmetrical in x j &.yk, i.e.,
/(*/; yk )=/(>*; *,)
log P(Xj /Xj ) t I
Thus,
P(*j) V(xj)]
/>(*,)
Relation with Channel Capacity ; The mutual information J(X, Y) indicates a measure of the average information per symbol transmitted in the system. A suitable measure for efficiency of transmission of information may be introduced by comparing the actual rate and the upper bound of the raw of information transmission for a given channel Shannon has introduced a significant concept of channel capacity defined as the maximum of mutual information. Thus, the channel capacity Cis given by
C = max/(;ir;n .
= nAxlH(X)-H(X/Y]
Q. 6. (b) State and prove Shannon-Hartley theorem.
Ans. For a Gaussian channel, P(x)
Jlna2
a
Hence, H(x)-J />{jc)log P(x )dx s
But - log P{x) = log Vino2 + log ex
Hence, H{x) = Jp(x) log ihta2. dx+ J P(x) log
-a -a
This may be evaluated to yield
H(x) - log V2nea2 bits/message
Now, if the signal is bandwidth to Hz, then it may be uniquely specified by talcing 200 samples per second. Hence, the rate of information transmission is
R(x) = 2aMx)
= 2colog>/27tj2 j
= log-\/2jtea2 j
tf(jt) = (olog(2W)
If P(x) is a bandlimited Gaussian noise with an average noise power N, then
R(n) = R(x) = <aio%(2neN) (v o1 =/V> .... (i)
The transmitted signal with average power S and the noise on the channel be while Gaussian noise with an average power N with the bandwidth to of the channel. The received signal will now have average power (S + N), K(y )is max when _y(/)'s also a Gaussian random process. Thus, the entropy from equation (i) on per second basis is given as :
R( y) = w log(2jte(5 + N)] bits/sec.
While the entropy of the noise is given by
/?() = co log(27te/V] bits/sec.
The channel capacity may be obtained as
CsmaxW-VHzi)] 1
= at log[2ne( + N >- <a log(2HejV)] '
, C = tologl + j bits/sec.
This equation is famous Shannon-H&rtley Theorem.
Q, ti. (c) A discrete memory less source produces five symbols with probabilities -, i,
2 4 8 16
& -- respectively. Determine the source entropy and information rate if the symbol rate is 10
16
Kbps.
Ans, The entropy H is
H-tr,
log-
*-l
1
log 2+~ tog 4+-log 8+ log 16+ log 16
2 4 8 16 16
= 01505+01505 + 01 128+01505
= 05643 bits/sec.
r = 10Kbps
Now
= )04 bits/sec.
Rate of information R is
R = rH = l04x 05643 = 5.643 x 103 bits/sec.
Q. 7. (a) Prove the foUowiog identities:
0)H(X, Y) =ff(Y/X) + H(X)
(ii) H(X, r) = H(X) + H{ Y) ifX and are statistically independent.
Ans. The relationship between the different entropies can be established as follows t
W(.V,K) = -Xp(x,* )log P(Xj, * )
>-!**[
, yk )log P(Xj j yk )+/>(.r., yL )10g P(yk )]
M **]
n
logO* I
Jfcl
ft
= W)-S%) log/>(>,)
&=1
Similarly, it can be shown that
For example, an experiment is performed 50 times, and the outcomes appears as given by the sequence below:
baabbbbabaaabbaaaababbabaababaaabbaababbbababbaa
II is seen that n = 50, nA =26, n6 =24, nAB =14, nBA -15
The different probabilities are as follows :
_ nA _ 26 p _nB _24
P(A)
n 50
n 50
P(AB)- = P(BA) = *-=!*
50 , 50
P(B/A) = - = P(A/B) = =~
26
3 24
Now/>(,4fl) = />M )P(8/A)g,ive$
14 26 14 u ,r .
=x, Hence verified.
50 50 26
& P{BA) = P(B)P(A/B) gives
15 24 15 . ...
= x hence verified.
50 50 24
Now, let us consider a situation where the probability of the event B occuring is independent of the event A. Such a situation would be true n the two*card problem is the first card were immediately replaced after having been drawn.
In this case then P(B(A) = P(B)
, implying that the probability of event B is independent of event A
.. P{AB) = PiA)P(B)
Similarly when probability of event A occuring is independent of event B, then
P{Ajfi)-P{*) , j
Implying that the probability of event A is independent of event B
P(BA) = P{B)P{A)
.. P(AB) = P(BA) = P{A)P(B)
>
The two events A & B are said to be statistically independent events if their probabilities satisfy the above equation.
Q. 7r(b) State and explain central limit theorem.
Ans. Central Limit Theorem : We know that both Binomial & Pnion rfistrihntimi anprnarhg* normal distribution asthe lugiting case that the sum of independent random variables will*
ijnpprnarK tViM-mat ictritmHnn Thf central limit theorem givqs a statement in this direction which states that.
The probability density of a sum of N independent random variables will also approach Jtsnwl distribution. The central limittheorem, thejnMii variance of the normal density are the sums of mean and variance of N independent random variables. For example,
The electrical noise in copinmnication systemis -dueto-a large number njanflnmiv mftviny
charged panicles.
Hence according to central limit th<oremth<e igstaoianfimis value ofnoise wilt have.a..nnrmal distribution. As binomial distribution has relationship with both Poisson and normal distribution, one would expect that there should be some relationship between Poisson and normal distribution. In fact it is found to be so. It has been seen that the Poisson distribution approaches normal distribution as A. -* a.
If it is large and if neither p not q is too close to zero, then the binomial distribution can be closely approximated by normal distribution with standardized random variable is given by
In practice np 5 and nqi.5 gives satisfactory performance.
Q. 8. Write short notes on any two :
(i) Cross Correlation function Optimum filter
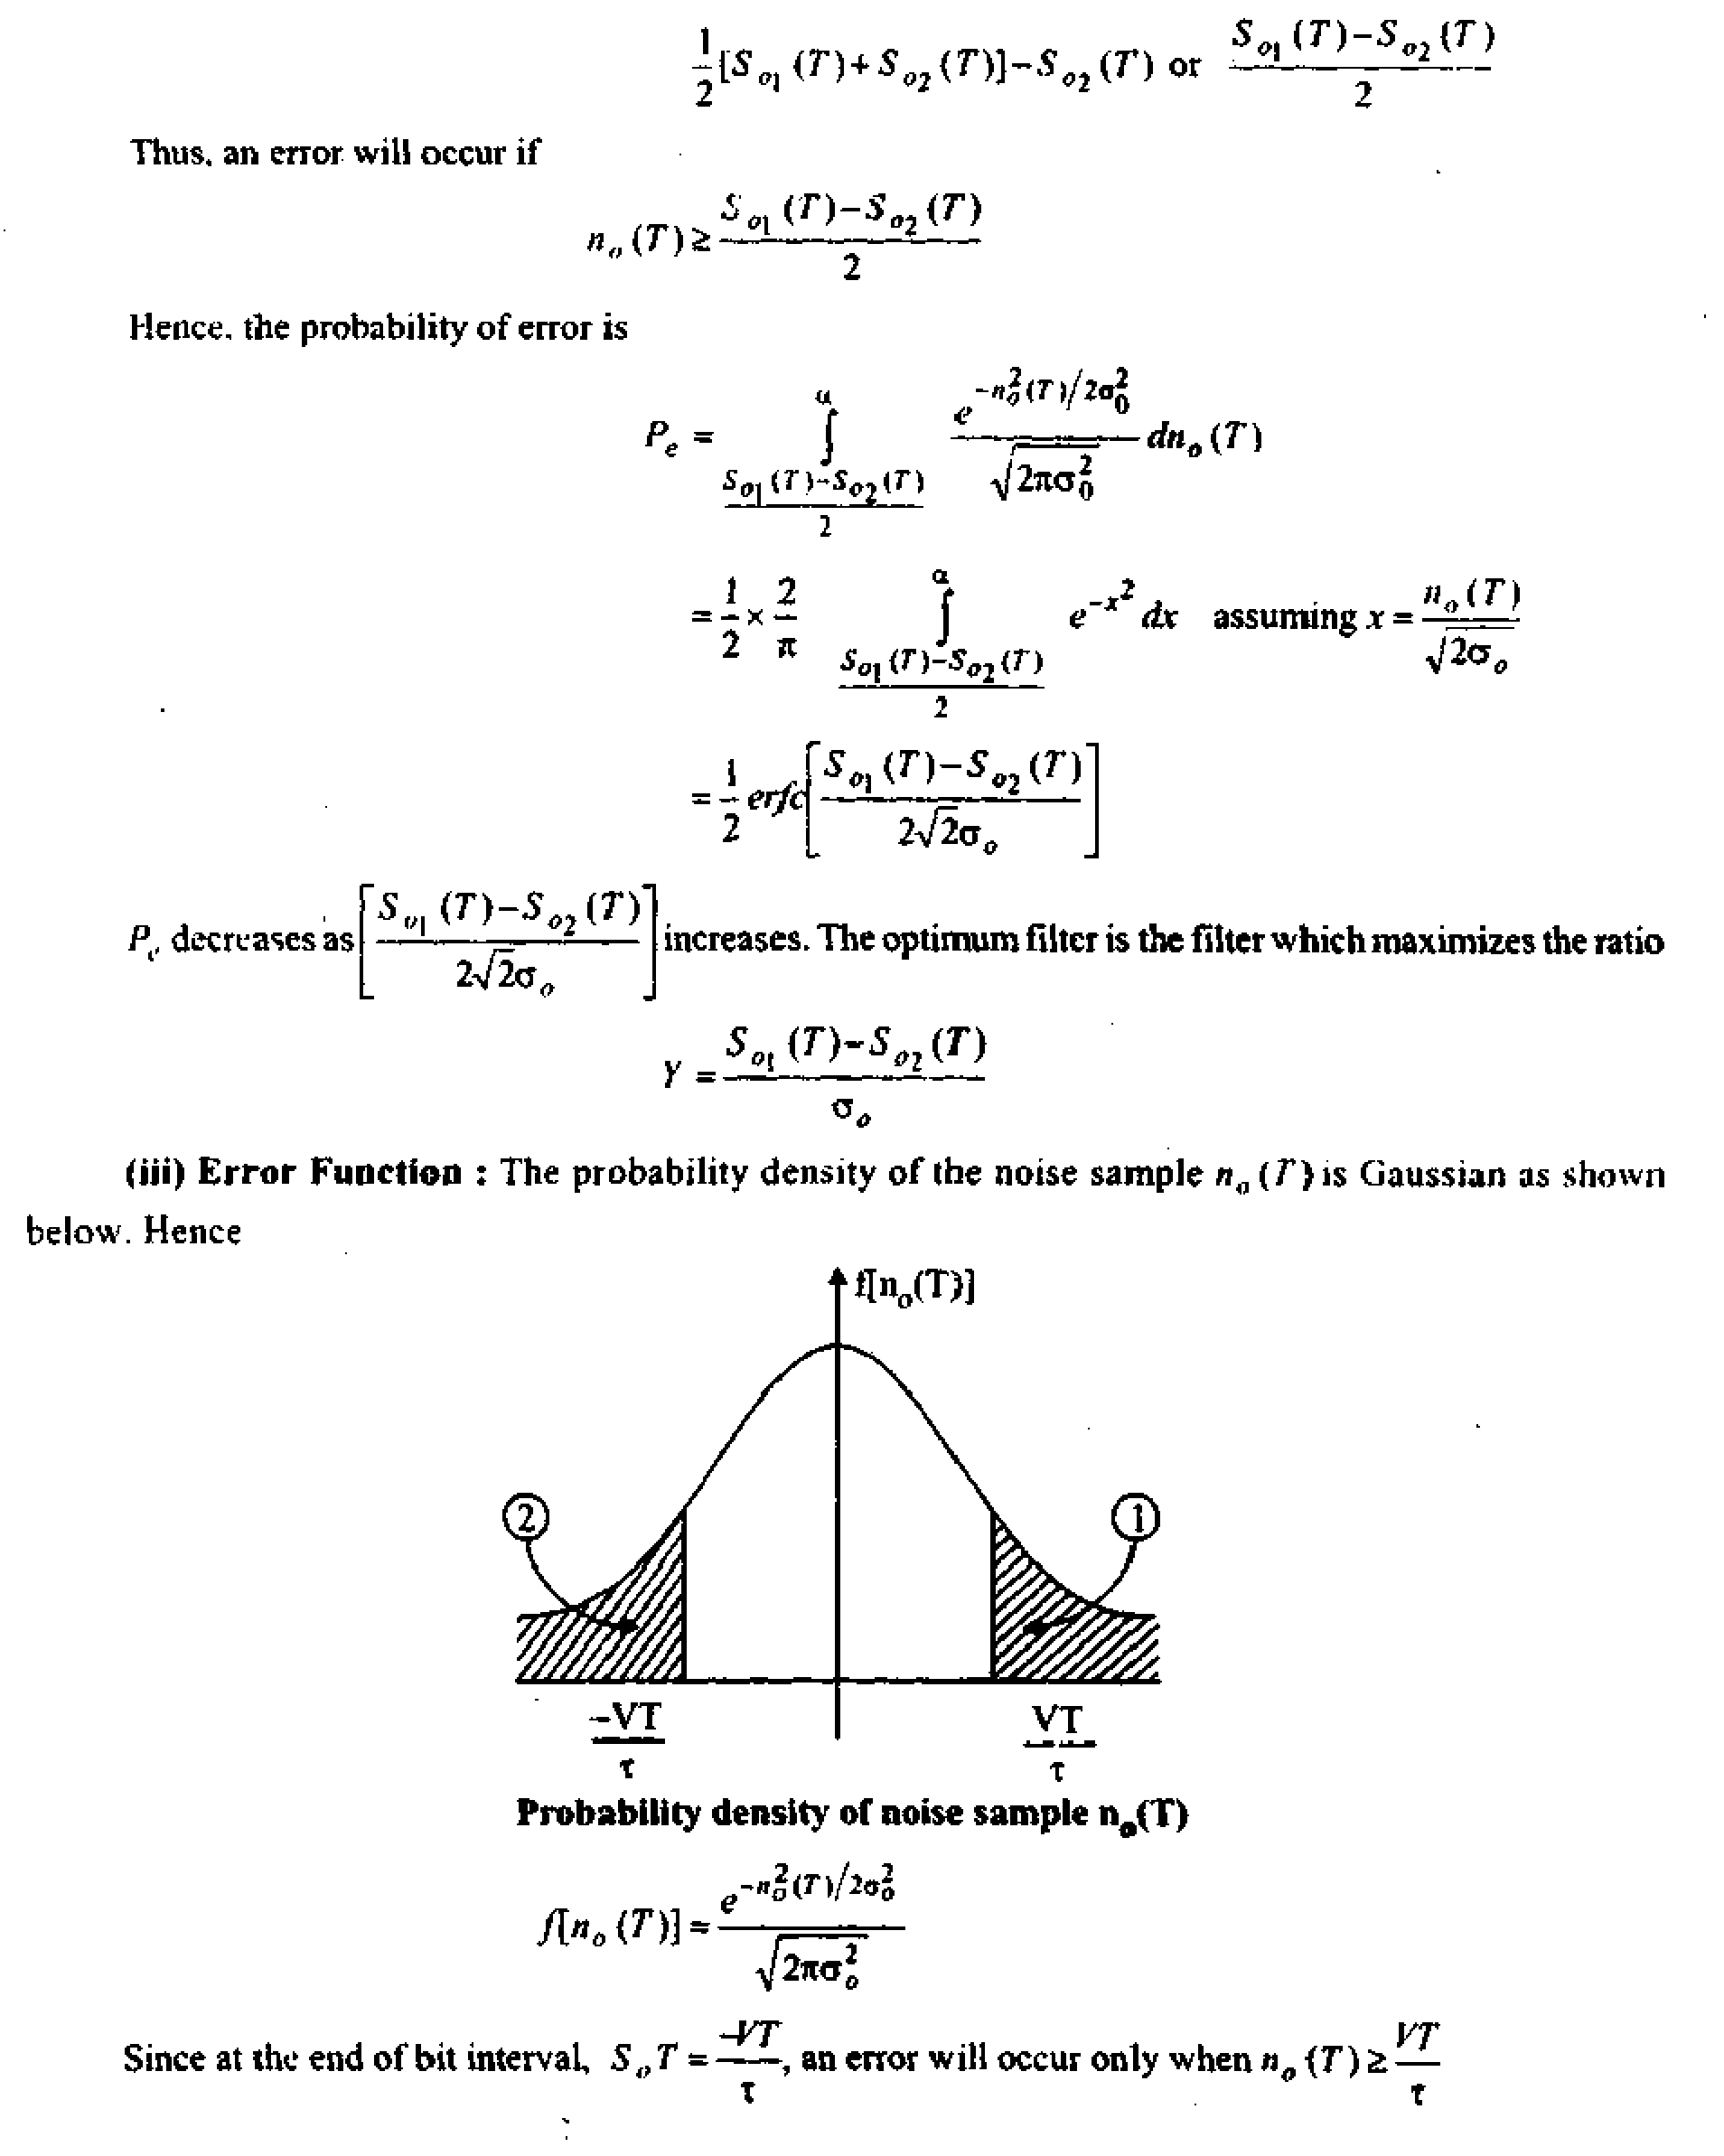
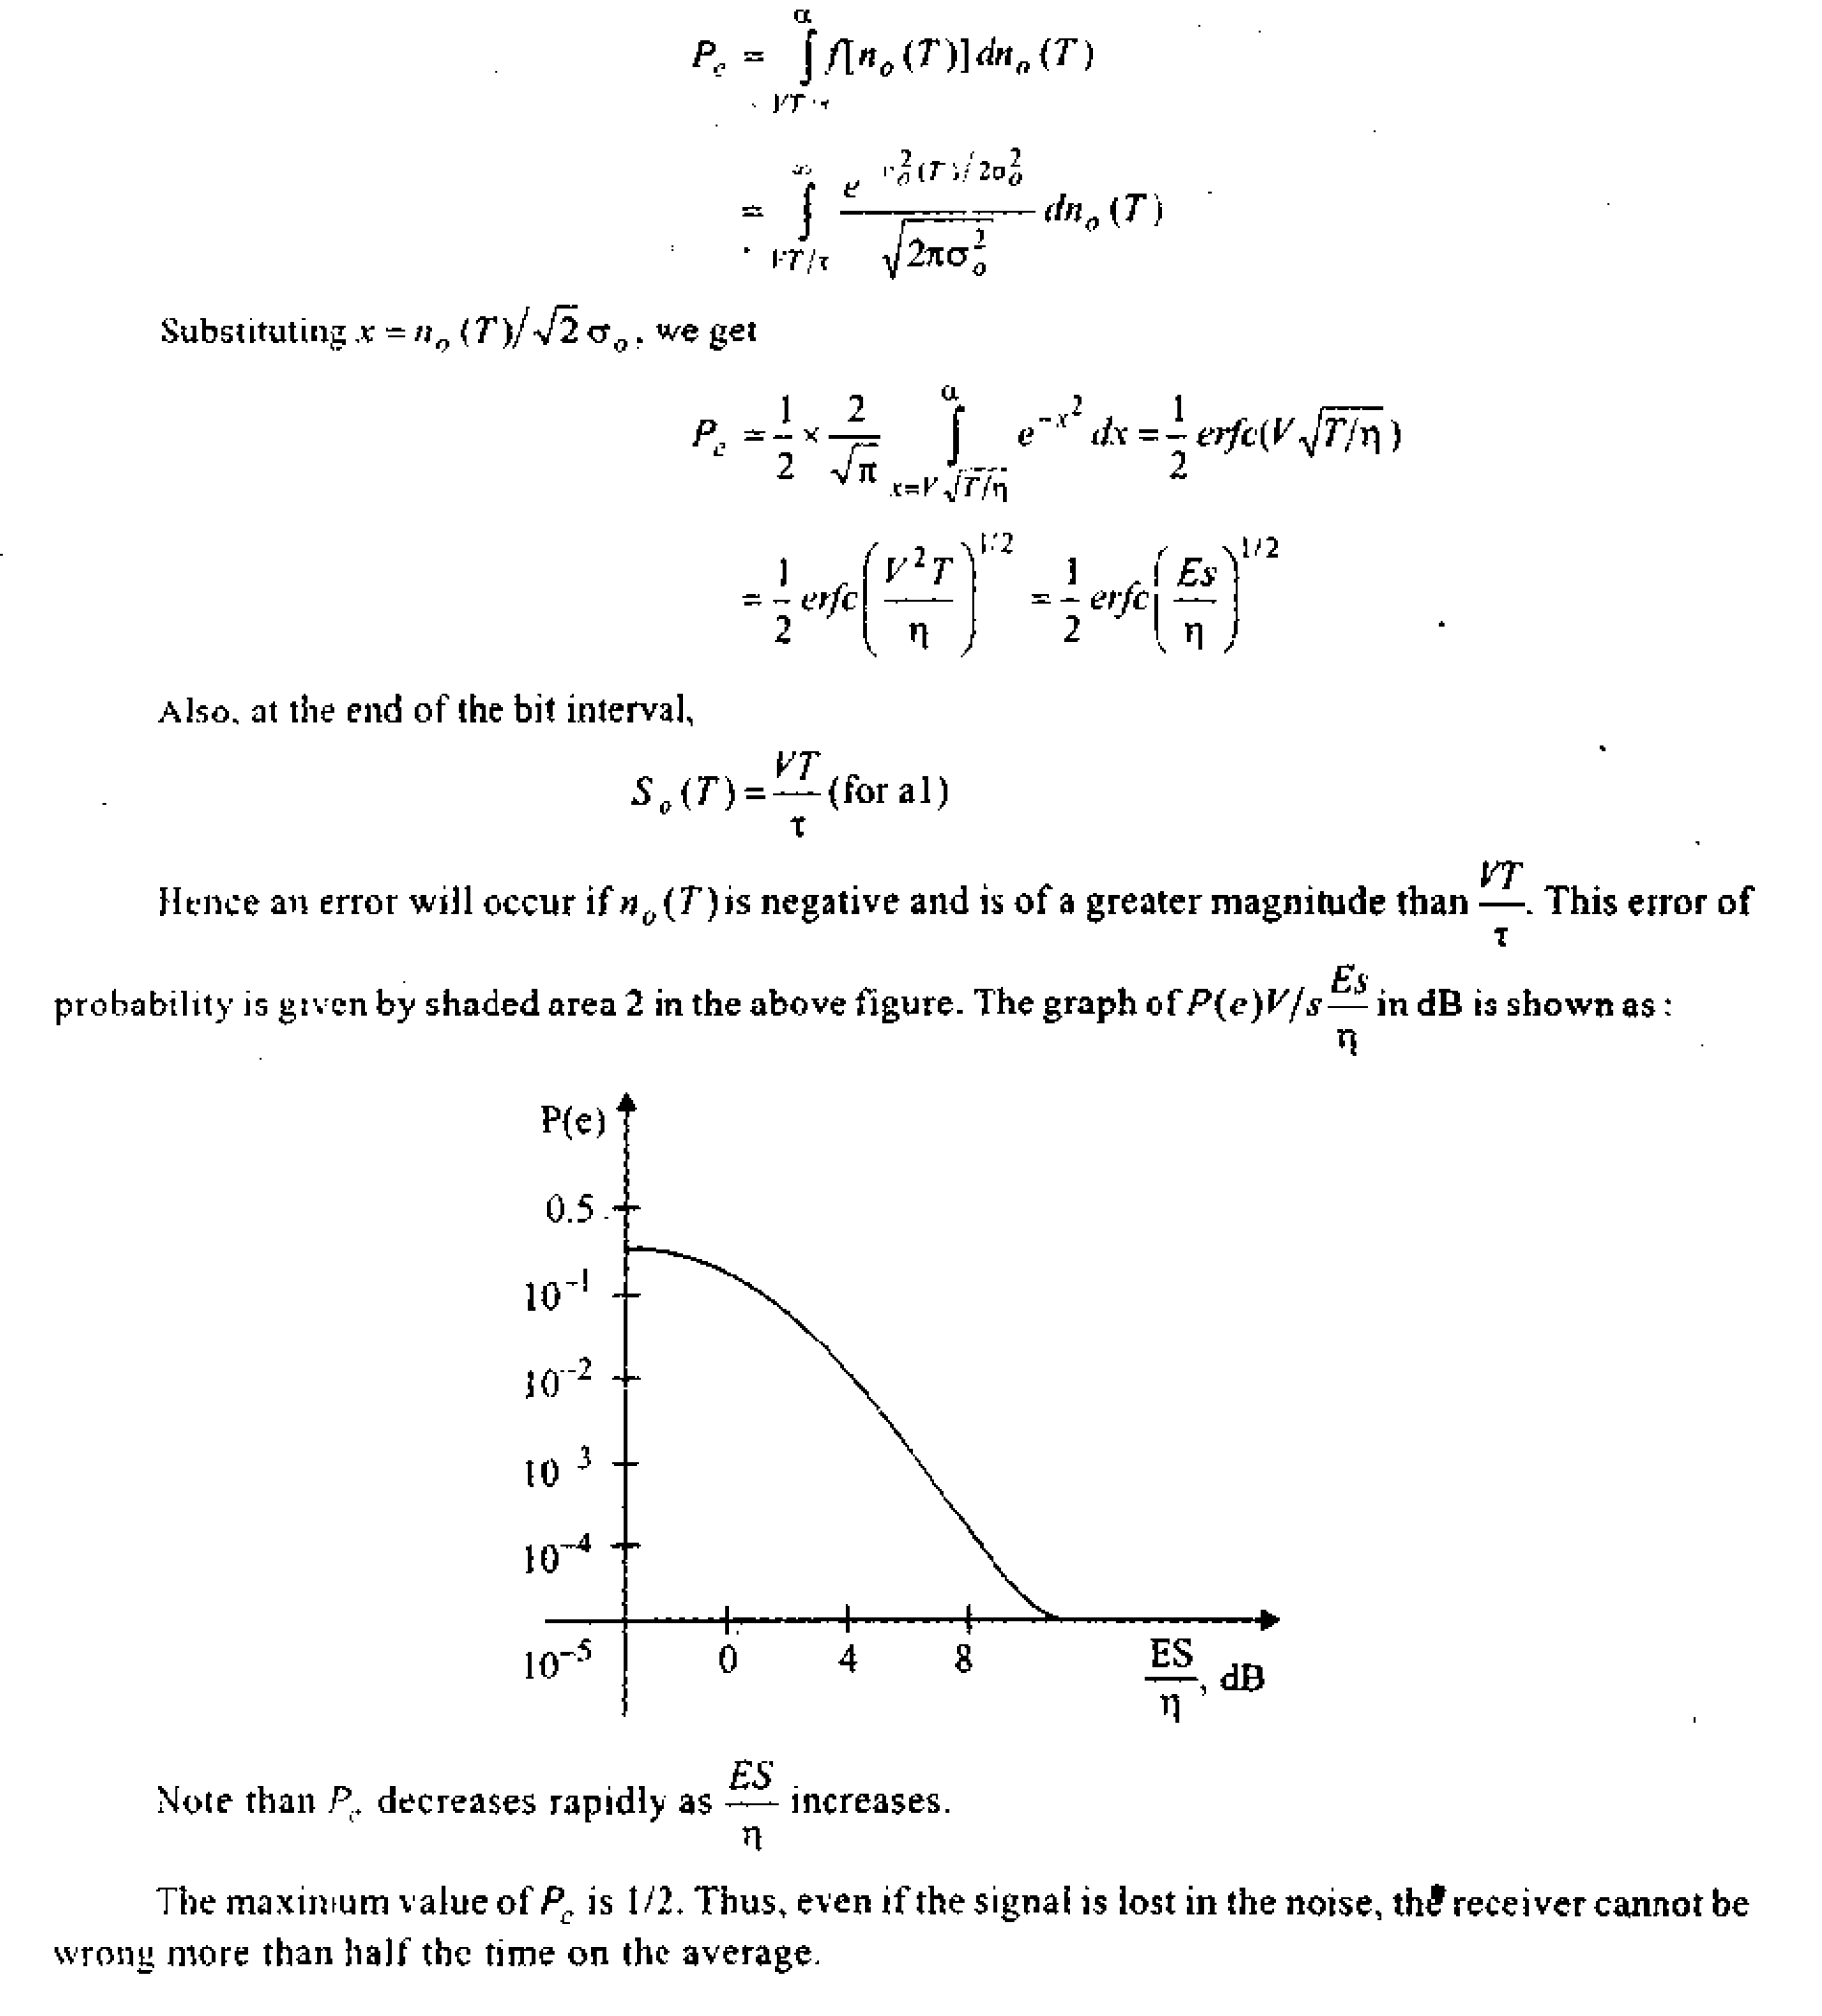
(iii) Error functions
Ans. <i) Cross Correlation Function : The correlation, or more precisely cross-correlations between two waveforms is the measure of similarity between one waveform and time>delayed version of the other waveform. This expresses how much one waveform is related to the time delayed version of the other waveform when scanned over time axis.
The expression for cross-correlation is very close to convolution. Consider two general complex functions /, (f) & />{/) which may or may not be periodic and not restricted, to finite intervals. The cross-correlation or simply correlation K12(t)between two functions is defined as follows :
-T>2
This represent the shift of function f2(t) by an amount -t (i.e., towards left), A similar effect can be obtained by shifting /t(f) by an amount +t (i.e., towards right). Hence, correlation may also be defined in an equivalent way. as
rn
lim
Ri2W = T a jAO-'iJiVW
Let us define the correlation for two cases (i) energy < non-periodic) functions & (ii) power (periodic) functions. In the definition of correlation, limits of integration may be taken as infinite for energy signals.
a
12(t>= J./i(0/: (f + T*//
a a
For power signal; of period r0. may not converge. Hence, average correlation over a period T$ is defined as :
1 ri2
*1 j/f(0/2 ( + tV<
0 ~T0/3
1 H1
y -To/:
The correlation definition represents the overlapping area between the two fun:tions.
(ii) Optimum Filter : In the receiver side, the signal is passed through a filter. It is important to known whether the filter is an optimum filter which gives the minimum probability of error.
If the input is, {f\ the output
V0(T) = S',i(T)+nJT)
Gaussian noised fn(T)]
Vo(0
Sample every T sec
An error will occur if at the sampling instant, the noise ng (T)is positive and larger than
The decision boundary is, therefore
Receive of a binary coded PCI 1
S0)(T>+n0(T>
or
' V(T) ='
Filter
Copyrights@IndiaStudyChannel Page 19
|
Attachment: |
| Earning: Approval pending. |