Institute of Actuaries of India 2010 CT-4 Models Core Technical ( ) - Question Paper
INSTITUTE OF ACTUARIES OF INDIA
EXAMINATIONS 10th November 2010 Subject CT4 - Models
Time allowed: Three Hours (10.00 - 13.00 Hrs) Total Marks: 100
INSTRUCTIONS TO THE CANDIDATES
1) Please read the instructions on the front page of answer booklet and instructions to examinees sent along with hall ticket carefully andfollow without exception
2) Mark allocations are shown in brackets.
3) Attempt all questions, beginning your answer to each question on a separate sheet. However, answers to objective type questions could be written on the same sheet.
Q 1) Briefly discuss deterministic modeling and stochastic modeling. Outline the key differences
between the two. [4]
Q 2) (i) State the independent increment property for a given stochastic process. (1)
(ii) State the Markov property for a stochastic process with a discrete state space. (1)
(iii) Prove that a process with independent increments has the Markov property. (3)
[5]
Q 3) A scientist identifies 1,000 newborn kittens and observes them during their first year of life. Scientist wishes to calculate a constant force of mortality () in the first year covering all causes of death. If the true |i is 0.05, calculate the probability that the hazard rate observed by the scientist is greater than 0.06. [5]
Q 4) Define Right Censoring, Left Censoring, Interval Censoring and Random Censoring with the
help of suitable examples. [6]
Q 5) A researcher is using a two-state Markov model to investigate mortality rates of parrots. The states are alive and dead. She commences the observation of a parrot when it is 2.5 years of age. The observation period ends when the parrot attains the age of 3 years or until it dies whichever is earlier. Transition intensity from alive to dead is 0.1 per year.
Let D be the random variable that takes the value:
1 - if a parrot under observation dies during the observation period 0 - if a parrot under observation remains alive until the end of the observation period
Let V be the random variable denoting the time under observation for a given parrot.
(i) State the probability function for D (1)
(ii) Calculate E(D) (1)
(iii) State, and briefly explain, the probability density/mass function for V (2)
(iv) Calculate E(V) (2)
(v) Explain, by general reasoning, the expected value of V that you calculated. (2)
Q 6) In a mortality investigation the number of deaths at age x during the period of the investigation is 0x, where x is defined as age last birthday at 1st April prior to date of issue of policy plus the number of 31st March passed since date of issue of policy.
(i) Explain the rate interval implied by the age definition above and the age range of the lives at the start of the rate interval. (3)
(ii) (a) State the Principle of Correspondence.
(b) Using this principle describe the central exposed to risk, , that would correspond to
(1)
the above classification of deaths. (2)
The estimated force of mortality for those aged x is

which estimates force of mortality, j-f| .Determine the value of f stating any assumptions that you make. (2)
Q 7) Consider the following time-inhomogeneous Markov jump process with transition rates as shown below:
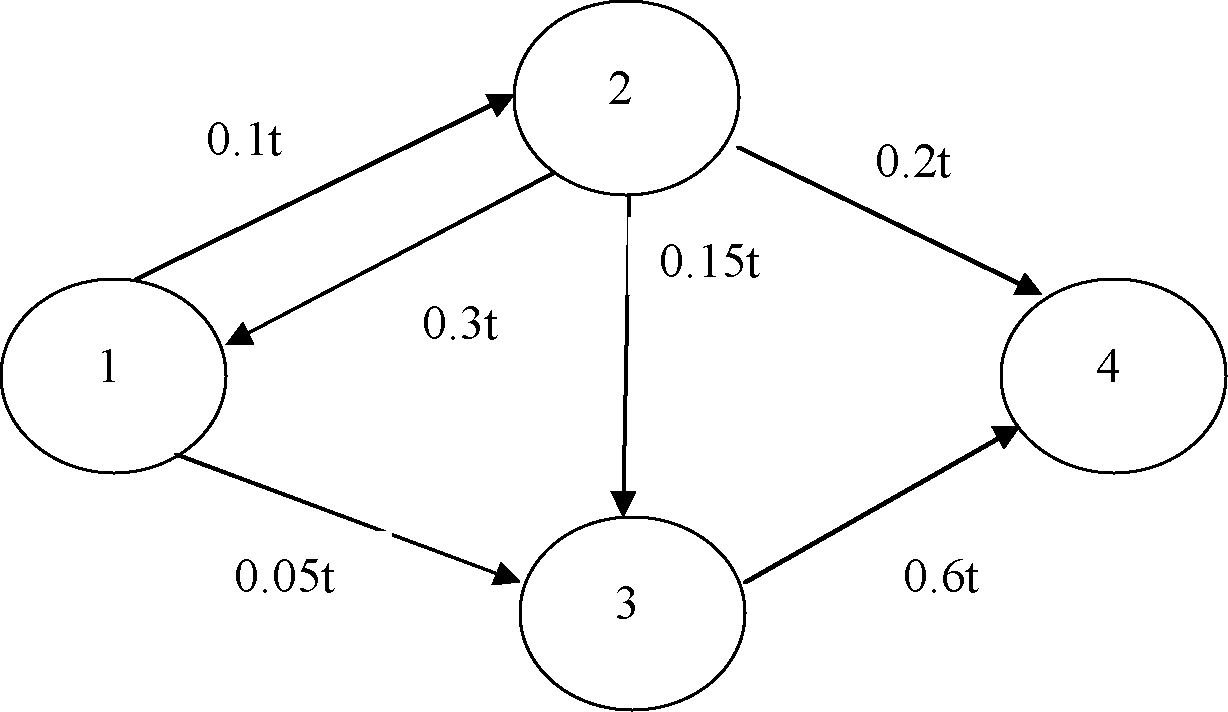
(i) Write down the generator matrix at time t. (2)
(ii) Write down the Kolmogorov backward differential equations for P33(s,t) and P13(s,t) (3)
(iii) Using the technique of separation of variables or otherwise, show that the solution of the differential equation for P33(s,t) is:
(4)
[9]
Q 8) An Institute conducts tuition classes starting from 9th standard as part of their preparation for the professional entrance exams. The management of the institute is concerned with the withdrawal rates of the children and hence it is testing a new tuition method to improve the persistency rates. Data have been collected and a Cox proportional hazards model has been fitted for the hazard of students leaving the course. Symmetric 95% confidence intervals (based upon standard errors) for the regression parameters are shown below.
Covariate Confidence Interval Course
- Engineering 0
- Medical [0.08, 0.25]
Tuition method
- Traditional 0
- New [-0.05, 0.05]
Sex
- Boys [0.02, 0.12]
- Girls 0
(i) Write down a general expression for the Cox proportional hazards model, defining all terms that you use. (2)
(ii) State the regression parameters for the fitted model. (2)
(iii) Describe the class of children to which the baseline hazard applies. (1)
(iv) Discuss the suggestion that the new tuition method has improved the chances of children continuing with the tuition classes. (4)
[9]
(i) Explain the meaning of the mortality rates usually denoted by qx and mx and the relationship between them. (3)
Q 9)
(ii) Write down a formula for tqx, 0< t <1, under each of the following assumptions about the distribution of deaths in the age range [x, x+1]:
(a) Uniform distribution of deaths
(b) The Balducci assumption (2)
(iii) A group of senior citizens aged x experiences a mortality rate of qx = 0.06.
(a) Calculate mx under each of the assumptions (ii)(a) and (ii)(b) above. (5)
(b) Comment on your results in part (a) above. (3)
[13]
|
Age Group |
Average Age |
Initial Exposed to Risk - Ex |
Observed deaths - 9x |
|
20-25 |
23 |
900 |
2 |
|
26-30 |
28 |
1200 |
4 |
|
31-35 |
33 |
1300 |
5 |
|
36-40 |
38 |
1500 |
7 |
|
41-45 |
43 |
1100 |
8 |
|
46-50 |
48 |
800 |
9 |
|
51-55 |
53 |
650 |
9 |
|
56-60 |
58 |
350 |
5 |
It was decided to graduate results with reference to the standard mortality rate of an assurance
o
table published by the actuarial institute using a formula qx = 2* qsx .The qsx is the standard mortality rate.
The standard mortality rates from the assurance table for the average ages are given below:
| ||||||||||||||||||
|
(i) Explain the terms Undergraduation and Overgraduation. (2) |
(ii) Using a test of the overall fit of the graduated rates to the data, test the hypothesis that the observed mortality rates are in accordance with the graduated rates as per the formula given above. (6)
(iii) Test the graduation using two other tests i.e. signs test and grouping of signs test. For each test:
(a) State the feature of the graduation it is designed to detect.
(b) Carry out the test.
(c) State your conclusion. (6)
Q 11) An airline company is planning to launch a Frequent Flyer scheme to increase its market share. The company has commissioned you to assist in designing a suitable scheme and assess the financial implications of launching the scheme.
Presently, the airline is serving 98,000 customers and it expects to have 100,000 customers by the end of 2010. Thereafter, it expects to add 5,000 new customers every year for next 5 years.
The average travel by a customer is 3,000 KMs per year and the airline generates a profit of Rs 5 per KM per customer.
Marketing Director has given you an initial design of the scheme. The customers will be classified into three categories - Standard, Gold and Platinum - depending on their travel distance during the previous calendar year.
|
Travel (in KMs) in the previous year |
Class |
|
< 2,500 |
Standard |
|
>= 2,500 and < 5,000 |
Gold |
|
>= 5,000 |
Platinum |
The scheme shall be effective from Jan 1, 2011 and the initial classification shall be made based on the customers travels in the year 2010. Initially, 65,000, 20,000 and 15,000 customers will be in Standard, Gold and Platinum class respectively. At the start of every calendar year thereafter, the customers status will change depending upon their travel distance during the preceding calendar year. Standard customers will not be given any discounts whereas the Gold customers will be offered discounted fares. Platinum customers will be offered higher discounts than Gold customers. As a result of discounts, the company will make profit of Rs 4.5 per KM and Rs 4 per KM respectively for Gold and Platinum customers as compared to Rs 5 per KM for the Standard customers. Airline believes that with the launch of the scheme, it will add 10,000 new customers every year for next five years instead of 5,000.
Based on some research carried out by a leading market research agency, the estimated transition probabilities between these classes are as follows:
|
Current Year |
Next Year Class | ||
|
Class |
Standard |
Gold |
Platinum |
|
Standard |
0.7 |
0.2 |
0.1 |
|
Gold |
0.5 |
0.3 |
0.2 |
|
Platinum |
0.3 |
0.4 |
0.3 |
Market research agency has also furnished some data on estimated travel distance for each of the classes.
|
Class |
Average Travel (in KMs) |
|
Standard |
1,700 |
|
Gold |
3,850 |
|
Platinum |
9,375 |
(i) Your first task is to make following projections for the calendar years 2011, 2012 and 2013 assuming that the company will continue as it is without launching the scheme;
a. Number of customers
b. Kilo Meters travelled by all customers
c. Profit to the company
(ii) Construct a Markov chain to estimate the number of customers in each of the three classes for 2011, 2012 and 2013 if the company launches the scheme. In your projection, incorporate the additional new customers each year in a suitable manner. (4)
(iii) Compute the projected profits for the three years if company launches the scheme. (5)
Further the Marketing Director has come up with a slight modification to the design. He thinks that the Platinum class customers should be given one additional year in the Platinum class as long as they travel no less than 2,500 KMs in one year. For example, a Platinum customer will continue to be in the same class if he travels 3,000 KMs in any year. However, if he travels 3,500 KMs in the next year as well; he would then move to the Gold class. Marketing Director believes that with this design, the company will be able to attract 12,000 new customers every year instead of 10,000.
(iv) Modify the states of the Markov chain and construct the transition matrix reflecting the above information. (3)
(v) Chief Executive Officer, Finance Director and Marketing Director have called you to the airlines office next week to discuss your results. Briefly describe various points that you would like to discuss during the meeting. State any additional information that you would
like to give them during your discussions. (4)
Page 7 of 7
|
Attachment: |
| Earning: Approval pending. |