University of Mumbai 2008 Post Graduate Diploma SYPGDORM Part - II - Advance Operation Reserch II - Question Paper
Kindly obtain the attachment. ylay - 2u>o
Pay,3ZTL' /lavcme Operation g&scxydrTL Cfor Firo*
Dtphmajr) t ys &<5=c*e*rcj->
rp\/ I T ~ Aduvcvnce Cprcior?
Con. 2184 & (a to ty~o' 3'vy)
ce
BB-8617 to 8619
?rcduc4)t!Y) sirem , [Total Marks : 100
(3 Hours)
N.B.(1) Attempt any five questions.
(2) Figures to the right indicate full marks.
(3)
(4)
(5)
(6)
Necessary explanations at intermediate stages must be given.
Use of non-prog ram m able calculator, statistical tables and Log tables is permitted. Answers should be brief and to the points.
Assumptions, required in the questions, where necessary must be explained.
10
|
1. (a) Demand distribution of cakes of a particular type was as follows | ||||||||||||
|
Purchase price = Rs. 12 per unit and selling price is Rs. 15 for fresh cake and Rs. 11 for one day old cake per unit.
Determine the optimum stock.
(b) Explain the following terms in inventory models.
10
(i) Reorder Level (ii) Buffer Stock
(ii) Safety Stock (iii) Desired level of performance.
2. (a)
10
(b)
10
Annual demand for an item is 500 units per day. Ordering Cost is Rs. 30 per batch. Production cost per item is Rs. 15. Inventory cost is per unit, 10% of unit cost, per year, Discount is 5%. Determine the break-down order quantity.
An investment corporation must invest Rs. 5 lacs capital in 3 investment projects P1, P2 and P3. The treasurer of the corporation has obtained information on the returns that can be reasonably expected from each project according to the amount of investment. The required information is as follows :
|
Capital invested in Rs. lacs |
0 |
1 |
2 |
3 |
4 |
5 | |
|
Return in Rs. lacs |
Pi |
20 |
30 |
50 |
80 |
90 |
100 |
|
P2 |
25 |
45 |
55 |
72 |
74 |
75 | |
|
Pa |
40 |
55 |
90 |
110 |
113 |
115 |
Determine the allocation for each project within the available budget in order to maximise the total returns.
3. (a) There are 4 products P19 P2, P3 and P4. The necessary information is given below :
20
k = Production rate, in 100 units per day. r = Demand rate, in 1000 units per year C1 = Inventory cost per unit per year in Rs.
C = Set up cost, Rs.
|
Product |
k |
r |
c3 | |
|
Pr |
10 |
40 |
010 |
10 |
|
P2 |
12 |
55 |
015 |
12 |
|
P3 |
9 |
20 |
012 |
20 |
|
P4 |
12 |
90 |
022 |
10 |
(i) Determine the optimum number of runs per year.
(ii) Find the optimum run length for each product.
4. (a) Explain Bellmans Principle in Dynamic Programming with illustration.
(b) A companys sales (in Rs. 1,000) for a certain product in 3 marketing areas, A, B and C for various levels of sales effort, are given as follows :
|
A PA4 |
Levels of sales efforts (in Rs. 1000) | |||
|
Area |
1 |
2 |
3 |
4 5 |
|
A |
40 |
45 |
50 |
60 55 |
|
B |
45 |
50 |
55 |
65 60 |
|
C |
70 |
75 |
85 |
80 50 |
Budget available for sales efforts is Rs, 5*000. Using Dynamic Programming approach, determine the optimum allocation of the budget in each Marketing Area. (Assume that moneys is spent in Rs. 1,000).
5. (a) For an inventory models, the following information is given :
|
Annual Demand Unit cost Set up cost Holding Cost Normal Lead Time Maximum Lead Time Calculate : (i) Buffer Stock (ii) reorder Level (iii) Safety Stock |
= 12000 units = Rs. 10 = Rs. 15 = Rs. 0'10 per unit per year = 20 days = 30 days (iv) Maximum Inventory (v) Minimum Inventory (vi) Average Inventory |
(b) Explain the following, with illustration :
(i) Markovian Process
(ii) Ergodic Process
(iii) Bayesian approach in Decision making.
6. (a) Following is the transition probability matrix for states S1 and S2.
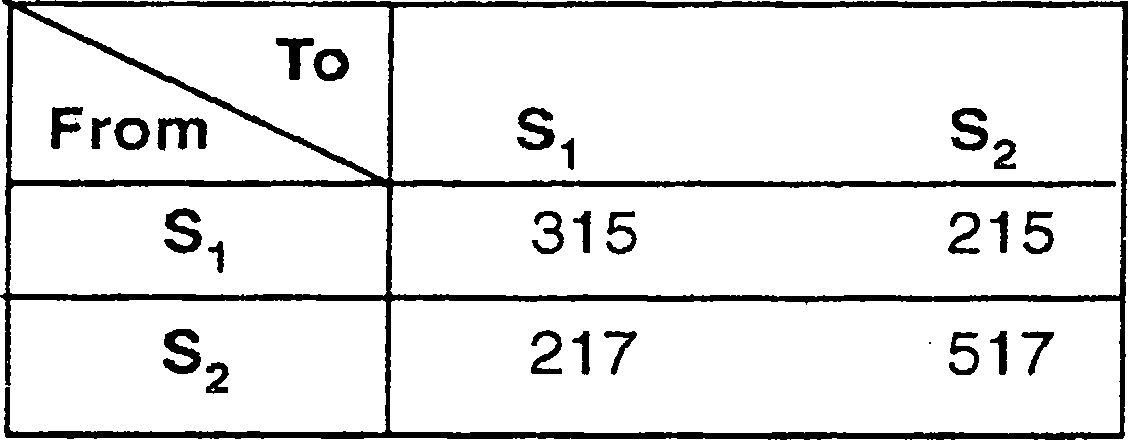
Determine the limiting probabilities for the Ergodic Process.
(b) Determine the shortest route, using dynamic programming frm A to G in the following diagram. Figures on the arcs indicate distances in kms, between cities A, B, C, D, E, F and G as shown below :
7. (a) The following table gives 3 proposals from branch Managers of each of the 3 plants 10
P2 and P3 with their costs (c) and revenues (R) in Rs. lacs. Total budget available is Rs.
5 lacs.
|
Proposal No. |
Pi |
2 |
P |
3 | ||
|
C |
R |
C |
R |
C |
R | |
|
1 |
0 |
0 |
0 |
0 |
0 |
0 |
|
2 |
2 |
4 |
3 |
9 |
2 |
6 |
|
3 |
4 |
8 |
5 |
14 |
3 |
9 |
Determine the optimal allocation of the budget for proposals of each of these plants in order to maximize the total revenue.
(b) Write short notes on : 10
(i) Markovian Decision Process with rewards
(ii) Howardes Policy Space Technique.
8. There are 6 market zones A, B, C, D, E and F and 6 workers. The following table indicate the 20 sales volumes (in Rs. 1000) in each region with number of workers. The region F requires minimum 2 workers. Allocate the six workers, to the regions in order to maximise the total sales volume.
|
Region |
No. of Workers | ||||||
|
0 |
1 |
2 |
3 |
4 |
5 |
6 | |
|
A |
3 |
5 |
6 |
8 |
12 | ||
|
B |
4 |
5 |
6 |
7 |
9 | ||
|
C |
5 |
8 |
10 |
11 |
13 | ||
|
D |
6 |
10 |
12 |
14 |
16 | ||
|
E |
5 |
6 |
9 |
11 |
13 | ||
|
F |
14 |
16 |
15 |
20 |
24 | ||
(3 Hours) [Total Marks ; 100
N.B.(1) Attempt any five questions.
(2) Figures to the right indicate full marks.
(3) Necessary explanations at intermediate stages must be given.
(4) Use of non-programmable calculator, statistical tables and Log tables is permitted.
(5) Answers should be brief and to the points.
(6) Assumptions, required in the questions, where necessary must be explained.
1. (a) The following data represent distances, in kms, between 7 cities A, B, C, D, E, F and G. 10 AB = 5, AC = 3, AD = 4, BC = 3, BD =7, BE = 3 CD = 3, CF = 6, DE = 4, DF = 8, EG = 10 FG = 9.
Using Dynamic Programming, determine the shortrest route from A to G.
(b) An item is prodused at the rate of 80 units per day, while demand per day is 50 units. If 10 the set up get is Rs. 200 per run and the inventory cost is five paise per unit per day, obtain :
(i) EOQ, and (ii) the minimum total cost per run.
Consider 4 products A, B, C and D with information as shown below : k = Production per day (in 100 units) r = Demand per year (in 1000 units)
C, + Inventory cost per unit per year C3 = Set up cost, in Rs.
2.
Assume that there are 250 days of production in a year.
|
Product |
A |
B |
C |
D |
|
k |
10 |
13 |
10 |
14 |
|
r |
45 |
60 |
30 |
100 |
|
c1 |
01 |
-02 |
-03 |
01 |
|
c3 |
10 |
12 |
20 |
15 |
(i) Determine the optimum run length for each product.
(ii) What is the optimum number of runs per year ?
(a) A company has to invest Rs. 5 lacs of capita! in 3 projects P1f P2 and P3. The following table in each project, in lacs of Rs.
10
3.
X = capital invested in Rs. lacs.
|
Revenue in Rs. lacs |
|
Using Dynamic Programming, determine the company's optimum allocation plan, (b) Profits, in thousand rupees, of a certain store from 2000 to 2005 are given below :
10
|
Year |
2000 |
2001 |
2002 |
2003 |
2004 |
2005 |
|
Profits |
40 |
45 |
55 |
60 |
80 |
100 |
Fit a quadratic regression equation to estimate profit in a given year.
4. Acompany wants to decide whether to continue with regional distribution of a product (a) or 20 expand to national distribution, (b) Research predicts that chancer for (a) are 70% with an expected return of Rs. 5 lacs and for (b) 30% with an expected return of Rs. 2 lacks.
Draw a decision tree and determine what decision the company should take.
|
5. (a) The following data gives the demand for an item, in 100 units, in 5 years 2002 to 2006. 10 | ||||||||||||
|
The initial value of the average of the period 1996-2001 is 3500. The initial value of the trend is zero. Using exponential smoothing with a = 0-3, estimate the demand for the year 2007.
(b) Explain the following terms with examples :
10
(i) Hertz and Hiller model for investment under uncertainty.
(ii) Markovian Decision Process with rewards
(iii) Ergodic Process.
10
B
Item
Yearly demand in 100 units
120
20
Price, in Rs. per unit.
15
10
20
Current policy is to order each item once each month.
(i) What is the optimal ordering policy which gives the same total average inventory ?
(ii) If the order cost is Rs. 30 and the inventory. Cost is 10% per year per unit what is the optimal policy ?
Suppose the company can afford average investment of only Rs. 15,000, what would be the change in the ordering policy so as to minimise total cost under this restriction ?
(iii)
An electronic device has 3 types of components A, B and C connected in series so that the failure of any one of them, will cause the failure of the device. The reliability (probability of not failure) of the device can be increased by installing one or more additional units of each of the component, in parallel. The following data gives reliability (R) and cost (C) for each components parallel units.
If the total available budget is Rs. 5,000, determine the optimal allocation.
10
|
No. of parallel units |
Component 1 |
Component II |
Component III | |||
|
R |
C |
R |
C |
R |
C | |
|
1 |
6 |
500 |
-6 |
1500 |
*5 |
1000 |
|
2 |
7 |
1000 |
8 |
2500 |
7 |
2000 |
|
3 |
9 |
1500 |
-9 |
3000 |
*8 |
2500 |
|
(a) A company has 4 salesmen for allocation to 3 market areas A, B and C. Volumes of sales, in thousand rupees, of each area with number of salesmen are as given below : | ||||||||||||||||||||||||
|
10
Determine the allocation of number of salesmen to each area in order to maximise the total sales volumes with 4 salesmen together.
(b) Explain with illustrations, the following terms :
(i) EPPI and EVPI
(ii) Howards Policy Space Technique
(iii) Value Determination Operation and Policy Improvement Routine.
10
Con. 2184 (b)-08.
[Total Marks : 100
(3 Hours)
N.B.(1) Attempt any five questions.
(2) Figures to the right indicate full marks.
(3) Use of Statistical Tables and Non-programmable Calculator is permitted.
(4) Answers should be brief and to the points.
(5) Intermedite explanations and calculations must be given.
(6) Assumptions, wherever necessary, should be clearly stated.
1. (a) Explain the following Qualitative Techniques in forecasting :
10
10
(i) Judgement (ii) Delphi technique. (b) Sales for 6 months are given beiow :
|
Month No. |
1 |
2 |
3 |
4 |
5 |
6 |
|
Demand |
450 |
500 |
510 |
485 |
465 |
570 |
Forecast for month 7 was 480 and initial value for new level was 10. taking a = 0-2 p = 0-3 forecast sales for month 8, by Peter Winters Model. [TURN OVER
Demand for an item is 20 units per month. Set up cost is Rs. 20. Production cost per 10 item is Rs. 4. Inventory carrying cost is Re. 0*5 per item per month. Shortage cost is Rs. 2 per item per month. Determine how often to make production runs and what size it should be, when shortage cost is allowed.
Explain procedure for multi proiduct EOQ when no shortage is permitted. ~ 10
2. (a)
(b)
|
3. (a) The probability distribution of the demand for a product is as follows : | ||||||||||||||
|
10
The cost per unit is Rs. 60 and selling price is Rs. 100 per unit. If a product is unsold then it is a waste. Assuming no reordering is possible, how many optimum units should be purchased per day ?
Explain (i) various components of a time series model (ii) additive model and multiplicative model for analysis of time series.
(b)
10
|
4. Consider 4 products A, B, C and D with the following information. Assume that there are 20 250 days of production in a year. | |||||||||||||||||||||||||
|
5. (a)
10
(b)
10
(a) Determine the optimum number of runs per year.
(b) What will be the optimum run length for each product ?
In the machine shop of a small scale industry, machines break-down with a mean rate of 4 per hour. The maintenance shop of the industry has 3 mechanics who can attend to the breakdown machines individually. The service rate of each of the mechanics is 2 machines per hour. Initially there are 10 working machines in the machine shop. Find : (i) P0 (ii) Lq (iii) Ls (iv) Wq and (v) Ws.
For the following 3x4 problem find optimal sequence of jobs by using (i) Palmeris algorithm and (ii) CDS algorithm.
|
Time, in minutes, for pocessing | ||||
|
Jt |
J2 |
3 |
4 | |
|
M, |
14 |
2 |
4 |
2 |
|
m2 |
12 |
6 |
9 |
5 |
|
m3 |
11 |
8 |
6 |
3 |
7. (a) There are 4 market regions and 6 salesmen. The following table indicates the sales volumes, in hundred rupees, in each region with the number of salesmen. Allocate the 6 salesmen in the corresponding regions, in order to maximize the total sales volume.
No. of Salesmen
|
Region |
0 |
1 |
2 |
3 |
4 |
5 |
6 |
|
A |
6 |
7 |
10 |
15 |
17 |
20 |
25 |
|
B |
5 |
6 |
7 |
8 |
10 |
12 |
15 |
|
C |
4 |
6 |
8 |
10 |
13 |
15 |
20 |
|
D |
5 |
4 |
8 |
6 |
7 |
12 |
15 |
(b) The following table gives transition probabilities for two states S1 and S2 :
|
From |
S, S2 |
|
Si |
2/3 1/3 |
|
S2 |
2/5 3/5 |
Determine the steady state probabilities.
i
8. (a) There are 3 market shares S1t S2 and S3 where
51 = 20% or more = Rs. 30 lacs (high)
52 = 10% to 20% = Rs. 10 lacs (medium)
53 = Below 10% = Rs. ( - 5) lacs (Low)
Priori probabilities for 3 states of nature are P(S1) = 0-4, P(S2) = 0*5, P (S3) = 0-1
A1 = Commenalize the product
A2 = Do not commenalize the product.
Calculate, EMV, EPPI and EVPI.
(b) Explain the following :
(i) Markovian Process with Rewards
(ii) Howard Policy Space Technique.
|
Attachment: |
| Earning: Approval pending. |