The Institute of Chartered Financial Analysts of India University 2010 C.A Chartered Accountant Final Revision Test s- 5 - Advanced Management Accounting (new ) - Question Paper
May 2010: The Institute of Chartered Accountants of India - Revision Test ques. papers (RTPs) Final Examination: Paper five Advanced Management Accounting (new course): May 2010 University ques. paper
PAPER - 5 : ADVANCED MANAGEMENT ACCOUNTING QUESTIONS
Basic Cost Concepts for Decision Making: Application of Differential Cost Techniques in Managerial Decision
Decision making - Make or Buy
1. A pump manufacturing company needs four components W, X, Y and Z. The manufacturing Components may be procured from outside. The cost, purchase price for the components and other information are given below:
| |||||||||||||||||||||||||||||||||||||||||||||
|
(i) There are constrains in machine time is manufacturing all components. Total machine lours available is only 12,000. |
(ii) Other alternative is to use machine time in a second shift which will attract 20% extra wages and other fixed overheads @Rs. 3,000 for 1000 hours or part threof.
Give your suggestion about the course of action for maximization of profit.
Decision Making - Make or Buy
2. A manufacturer of household Pressure Cooker buys 20,000 components annually from a supplier @ Rs.45. Production manager has given a proposal of manufacturing the component in their own factory, the detailed cost estimates are given a below:
| ||||||||||||||||||
|
flexibility to enhance the production to the extent of 25, 000 units of Pressure cooker It has been indicated that for enhancing the production the banker of the company has in principle agreed to arrange additional working capital requirement of Rs 20.00 lakhs at a | ||||||||||||||||||
cost of 12% annum .However, marketing department has indicated that price of Pressure cooker may require reduction in price by at least 4% to take care of additional sale. Existing per unit sales price of Pressure Cooker Rs. 1,300 and Contribution is Rs.250.
As the production cost is more than the procurement price from the market, management of the company seek your views as Management Accountant on Make or Buy decision.
Decision Making -Profit maximization
3. ABC Ltd has prepared the following budget estimates;
|
Product A |
Product B | |
|
Sales Units |
6,000 |
16,000 |
|
Rs/ unit |
Rs / unit | |
|
Selling Price |
40. |
64 |
|
Direct Material |
12 |
22 |
|
Direct wages Rs. 8 per labour hour |
8 |
12 |
|
Variable overheads |
4 |
6 |
|
Fixed overheads |
8 |
12 |
|
Total cost |
32 |
52 |
|
Profit |
8.00 |
12.00 |
Capacity in linked with labour hours usage. After finalization of the above manufacturing programme, it was observed that one third of the capacity still remained idle.
In order to improve the working in the plant, the following proposals are put up for consideration:
(i) Discontinue product A and capacity so released may be utilized for production of B. Selling price of product B will, however be decreased by Rs 2 per unit to take care of increased volume of sale.
(ii) Discontinue Product B and use the capacity so released to produce product C which has demand is export market. Sales price and cost of manufacturing per unit of C is given below :
Selling price Rs 52
Direct Material 15
Direct Wages 10
Variable overheads 5
(iii) Utilize the idle capacity for meeting an export demand for product D whose sales price and cost data are given as below :
Selling price Rs 72
Direct Material 20
Direct Labour 20
V. overheads 10
Additional Fixed Cost for production of D will be Rs 70,000.
(iv) Hire out the idle capacity for Rs 60,000 annually . .
Evaluate each proposal and give you views.
Decision Making - Profit Maximization
4. XYZ Ltd is manufacturing two products X and Y, the details of which are given below :
|
Product X |
Product Y | |
|
Sales Unit |
5000 |
10000 |
|
Capacity utilized |
25% |
40% |
|
Selling Price |
Rs 1000 |
Rs 1200 |
|
Direct Material |
300 |
500 |
|
Direct Wages ( Rs 100 per worker-day) |
250 |
200 |
|
Variable Overheads ( 100 % of D Wages) |
250 |
200 |
Fixed Overheads of Rs 20 lakhs will remain unchanged at present level of production.
While making a production plan for the next year, the following changes which are expected to have impact on cost are given below :
(i) Rise in Cost : Direct Material and Direct Wages is expected to rise by 5%. Variable overheads will reain 100% of Direct Wages.
(ii) Rise in Price : Present volume of sale can be achieved with 6% rise of Price of A and 4% rise in B.
Proposal 1 : Use idle capacity to produce X, keeping present price to take care of additional sale.
Proposal 2 : Produce Y with idle capacity with no increase in price. Efficiency may go down because of newly recruited workers.
Proposal 3 : A new product Z may be manufactured which requires 3 worker-day per unit and the estimated selling Price, direct material per unit will be Rs 1350, Rs 400 respectively. Variable Overheads will be 100% of Direct Wages, Selling & Distribution Expenses and other fixed costs are expected to go up by Rs 6.50 lakhs.
Considering the rise in cost, you are required to examine the above three proposals and compare with the profitability of the next year with normal production of current year.
Decision Making : Relevant Costing
5. A company has undertaken a market survey and accordingly decided to launch a new Product P which is expected to have demand of 1,00,000 units in a year @ Rs.200. The following information has been furnished by the company.
|
(i) Material - The manufacturing of P requires one unit of 3 types of material | |||||||||||||||||||||||
| |||||||||||||||||||||||
|
(ii) Direct Labour - | |||||||||||||||||||||||
Skilled Labour 0.25 hrs / unit @ Rs.100 per hour
Unskilled Labour 2 hrs / unit @ Rs.70 per hour
Skilled workers' contribution per hour is Rs.150 per hour.
There is abundant unskilled labour in the factory but according to agreement with Union, no worker can be retrenched.
(iii) Machine: Two Machine M1 and M2 are required to produce C. M1 is in regular use and M2 is in the process of selling out. Company charges depreciation on straight line basis.
| ||||||||||||||||||||
|
(iv) Overheads: Variable overhead - Rs.15 per unit, Fixed overhead allocated for the product C is Rs.18 lakhs p.a. (Depreciation of machine not included). |
Estimate Cost of Product C based on relevant costing
Decision Making - Buying a Machine
6. AB Ltd. Received an order from a valuable client of supplying 3,00,000 pieces of components @Rs. 750 unit a year at a rate of 25,000 per month. Cost of manufacturing of the component is estimated as:
Rs. /Unit
Material 500
Labour 50
Variable overhead 40% of labour 20
Variable selling & distribution overhead 2
Fixed Production overheads is 30 lakhs.
There is a penalty/ reward clause of Rs. 30.00 per unit for supplying less / more than
25,000 units per month. To adhere to the schedule of supply, company procured a special machine costing Rs. 20 lakhs, which is expected to fetch Rs. 5 lakhs after the end of the contract of supply of components. After supply of machine, supplier offered another advanced technology machine ( new in the market) with 20% more output per hour but there will be material wastage 0.5%. The new machine cost is Rs. 15 lakhs but will have no resale value after completion of the project. If advanced version machine is purchased, earlier machine recently supplied will be immediately taken back at Rs 15 lakhs. Fixed cost of maintenance for the advanced version will increase by Rs. 20,000 per month. Entire job is expected to be completed within 10 months. Advise whether the company should go for the improved version machine.
Pricing of an Export Order.
7. A company is operating at 60% capacity with a turnover Rs.
.40 lakhs.
(i) If the Company works at 100% capacity, the sales-cost relation is: Factory Cost is two-third of sales value.
(ii) Prime Cost is 75% of Factory Cost.
(iii) Administrative and selling expenses (75% variable) is 20 % of sales value.
|
(iv) Factory overhead will vary according to operating capacity as given below : | ||||||||||
|
The company has planned to operate at 80% capacity. Moreover, it has received an export order and the execution of the same will involve 40 % of capacity. The prime cost of the order is estimated as Rs. 12.00 lakhs and shipping expenses involved will be Rs 2.00 lakhs. Taking same percentage of profit on domestic sale, determine minimum price to be quoted for the export order.
Product Pricing
8. A company has launched a new product in its consumer product division with an investment of Rs 30.00 lakhs.. The product is packed in pastic bags of 100 gms and cartooned in boxes of 50 each. The following information for the first two quarters are extracted from books of Accounts :
|
Quarter Ending on 30.09.2010 |
Quarter Ending on 31.12.2010 | |
|
Box ( Nos) |
3000 |
5000 |
|
Sales ( Rs lakhs) |
15.00 |
25.00 |
|
Production Cost ( Rs lakhs) |
9.50 |
14.50 |
|
Selling & Dist Exp ( Rs Lakhs) ( 50% variable) |
4.40 |
6.40 |
The Sales Department expects that there will be an increase in sales next year by 20% compared to quarter ending with 31.12.2010. It is anticipated that there will be increase in variable cost by 10%. Variable Selling & distribution expenses will remain same for the next year but it is budgeted to increase Fixed Selling & Distribution expenses by 25% to consolidate the market position of the product. The company expects 15% post tax return on investment ( tax 50% ).
Calculate the price at which the product is to be sold next year and give your comments.
Service Cost
9. A Hotel having 50 single rooms is having 80% occupancy in normal season (8 months) and 50% in off. season (4 months) in a year (take 30 days month).
Annual fixed expenses (Rs. Lakh)
Salary of the staff (excluding room attendant) 7.50
Repair & Maintenaance 2.60
Depreciation on Building & Furniture 2.40
Other fixed expenses like dusting, sweeping etc. 3.25
Total 15.75 Variable expenses (per guest per day)
Linen, Laundry & security support Rs. 30.00
Electricity & Other facilities Rs. 20.00
Misc expenses like attendant etc Rs 25.00
Management wishes to make a margin of 25% of total cost.
(a) Calculate the tariff rate per room.
(b) Calculate the Break Even Occupancy in normal season assuming 50% occupancy is off-season.
(c) Management is proposing 20% cut in tariff to improve occupancy at 100% and 70% in normal season and off-season respectively,. Give your views on it.
(d) What is the minimum rise in occupancy % to takes care of risk of fall in profit due to tariff-cut ?
Transfer Pricing
10. AB Ltd. has two divisions A & Division B. Division A produces components, two units of which is required for one unit of final product produced by division B. Division A has a capacity to produce 20,000 units and entire quantity is supplied to Division B @ Rs.200 per unit. Variable cost of component at Division A is Rs.190 and fixed cost is Rs.20 per
unit. .For final product of Division B, per unit variable cost ( excluding component) is Rs.700 , fixed cost Rs.200 and selling price is Rs 1500.
Division A has placed an proposal for increasing the transfer price to Rs.220 i.e. their market price. Division A's facility can be rented out @ Rs.3.00 lakh annually. Division A argument is that instead of making loss on transfer, facilities can be rented out.
Division B's argument is that it can buy the same component from outside market @ Rs.210.
Division A has given another proposal to augment its capacity to 40,000 units with an investment of Rs 15 lakhs so that it can sell 20,000 units to external market and transfer 20,000 units to Division B at Rs 210 per unit. Fixed cost for Division A will go up by Rs 1.00 lakhs.
You have evaluate the following and give your views :
(a) Division A facilities rented out and Division B buys components @ Rs 210 from outside market.
(b) Division A sells components to outside @ Rs.220 and Division B buys components @ Rs 210 from market.
(c) Proposal of enhancement of capacity of Division A to 40,000 units. ( assume capital cost @ 12%)
Transfer Pricing
11. XY Ltd has two divisions X Ltd and Y Ltd. X division has maximum capacity of producing 10 lakhs components but producing at present 9.0 lakh components annually and selling the same to external market @ Rs 250 per unit.
Y division procures 5.0 lakhs units same component X to manufacturing the final product
Y @ Rs 220 per unit. Through a negotiation between X division and Y division, Y division has agreed to take all its 5 lakh unit components X @ price of Rs 240 per unit as saving on account of distribution cost will help X division to maintain the same profit of Rs 70 per unit. X division will use its maximum capacity to satisfy the demand of external market.
In order to maximize the profit of the company, give your views on transfer price under following scenario :
Scenario 1 : Tax rate of X division is 40% and that of Y division is 50%
Scenario 2 : Tax rate of X division is 50% and that of Y division is 40%
Target Costing
12. A company has sales of 1.00 units at a price of Rs 200.00 per unit and profit of Rs 40.00 lakhs in the current year. Due to stiff competition, the company has to reduce its price of product next year 5% to achieve same volume target of sales. The cost structure and profit for the current year is given as below :
Rs lakhs
Direct Material 60.00
Direct wages 45.00
Variable Factory Overheads 20.00
Fixed Overheads including sales & admin exp 35.00
Total Cost 160.00
To achieve the target cost to maintain the same profit, the company is evaluating the proposal to reduce labour cost and fixed factory overheads. A vendor supplying machine for suitable for the company's operation has offered an advanced technology semi-auto machine of Rs 20 lakhs as replacement of old machine of worth 5.0 lakhs. The vendor is agrreable to take back the old machine at Rs 2.70 lakhs only. Company's policy is to charge depreciation @ 10% on WDV. The maintenance charge of the existing machine is Rs 1.20 lakhs per annum whereas there will be warranty of services free of cost for the new machine first two years. There are ten (10) supervisors whose salary is Rs 1.50 lakhs per annum.
The new machine having conveyor belt is expected to help in cost cutting measures in the following ways :
(i) improving productivity of workers by 20%
(ii) cut down material wastage by 1.0 %
(iii) Elimination of services of supervisors because of auto facilities of the machine
(iv) Saving in packaging cost by Rs 1.5 lakhs.
Assuming cost of capital to be 15%, calculate how many supervisors are to removed from the production activities to achieve the target cost.
Budgeting
13. In your company, budgeted sales for following months of year 2010 are given below :
March April May June July Aug
Sales in Rs Lakhs 600.00 650.00 620.00 620.00 630.00 640.00
(i) Cash sales is 20% and Credit sales is 80%. Credit for one month only.
(ii) Contribution/ Sales ratio is 40%.
(iii) Fixed cost for the whole year is budgeted to be Rs 300.00 lakhs expected to be evenly distributed over all months. Fixed cost does not include depreciation of Rs 14.4 lakhs. Fixed costs incurred are paid in the same month.
(iv) 40% of each month's sale is produced in the previous.
(v) 50% of the direct material required for production is purchased in the previous month.
(vi) 60% of variable costs are direct material cost. Material is procured at one month's credit.
(vii) 30% of variable costs are direct labour cost which is paid in the same month.
(viii) remaining variable costs are variable overheads. 40% of variable overheads are paid in the same month and balance in the next month.
(ix) Balance required as on 1st of April, 2010 is Rs 40.00 lakhs.
You are required to prepare for the quarter April - june 2010 (a) A statement of profit & loss and (b) Cash budget for the period
Variance Analysis
14. ABC Ltd. is following a standard costing system. The standard output for a period is 20,000. Details of the standard cost and profit per unit are given below:
Direct Material (3 units @ Rs.150) Rs 450.00
Direct Labour (3 hour @ Re.100) 300.00
Direct Expenses 50.00
Factory overhead-Variable 25.00
-Fixed 30.00
Admin Overhead 30.00
Total Cost 885.00
Profit 115.00
Sales Value 1000.00
Actual production and sales for the year was 14, accounts. There has been two price revision during the period. The following are variance worked out of the end of the period.
Favourable (Rs.'000) Adverse (Rs.'000)
Direct Material Price Usage
425
105
Direct Labour Rate
400
Efficiency
320
Factory Overhead Variable Expenditure Fixed Expenditure
40
Administrative overhead
Calculate actual cost and profit for the period.
Activity Based Costing
15. A Company is manufacturing 4 products A, B, C, D. The details of production and cost components are given below. The company at present is following the system of overheads distribution based on machine hours used by the products. Some details of different service activities, which are at present included in total factory overheads, and usage pattern of these activities by the products are also indicated.
|
Output in units Cost Per Unit :
Direct Material Direct Wages Machine Hours per unit Details of activities : Machine Operation Set Up Cost Stores Receiving Inspection Material Handling |
Cost Driver Amount ( Rs) 94,500 40.000 5,000 10.000 2,532 No of Production Run No of Requisitions No of Production Run No of Orders |
(i) Machine Operation Cost should be divided to Set -up cost, Stores and Inspection in 4:3:2 ratio.
(ii) Production run is for each 24 units.
(iii) Number of separate requisitions for each product is 50
(iv) No of Orders placed for each batch of production of 12 units
You are to calculate the costs of these different products on the present system and on the basis of Activity Based Costing, show the differences and give your comments.
16. In your company, production manager has observed that learning curve theory is very much applicable in the newly procured machine @ 90%. A batch of production is of 50 units. The average labour cost for the first batch is Rs 100. Material Cost and Overheads are Rs 150 and 50 per unit respectively. If profit margin is 25% on cost, estimate the price per unit if the order size is for (a) 400 units and (b) 800 units (c) 1000 unit
JIT & Service Costing
17. (a) What do you mean by back-flushing in JIT system? What are the problems that
must be corrected before it will work properly?
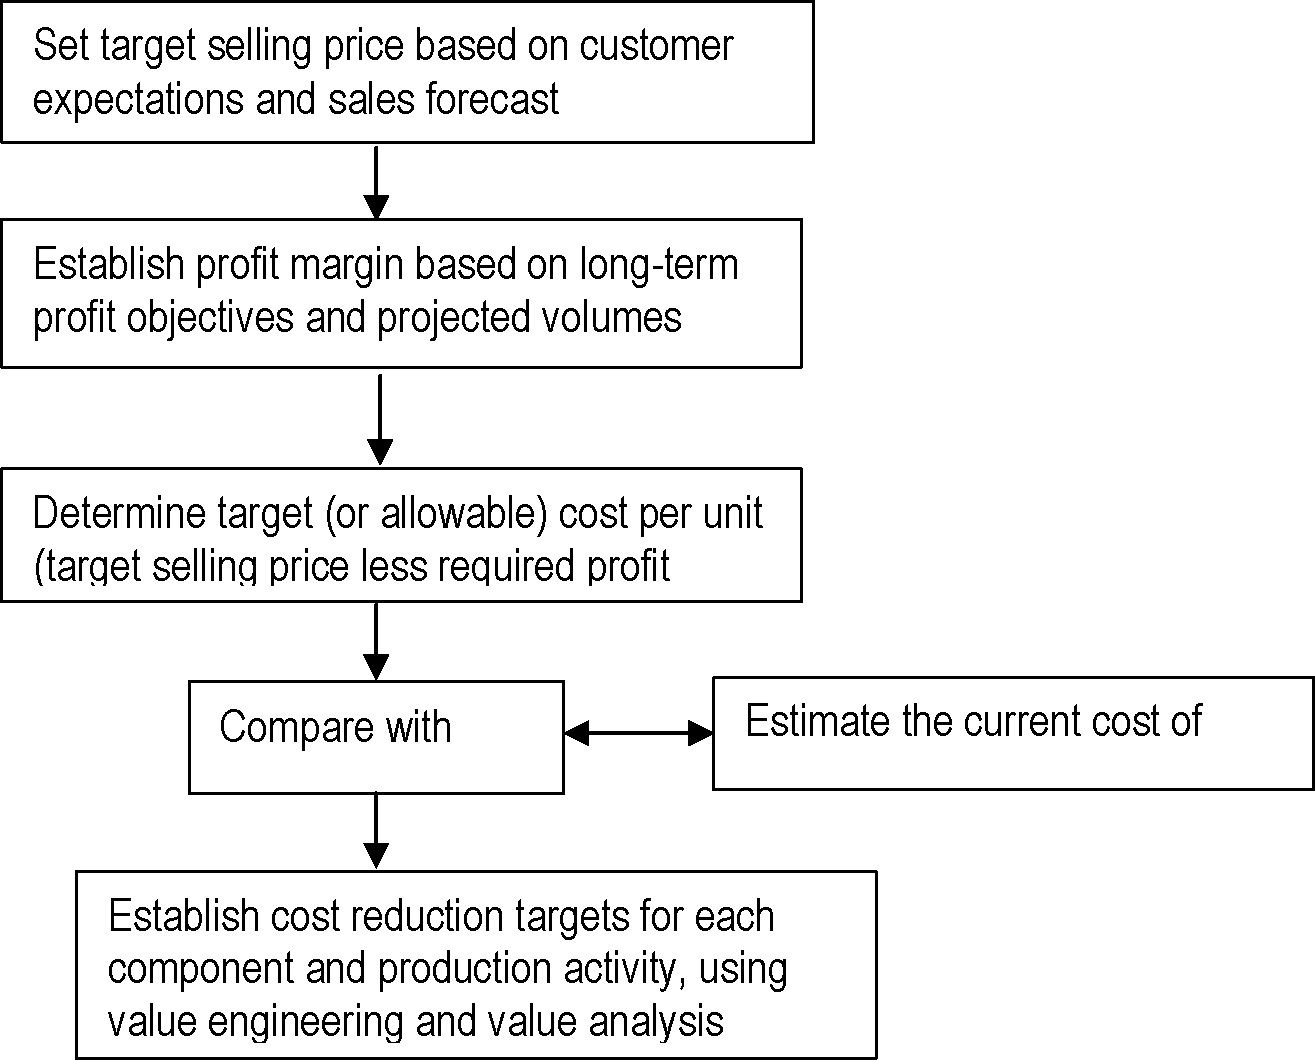
(b) What is Target Costing and list the steps involved in target costing process .
Quality Management & Value Chain Analysis
18. (a) Define Total Quality Management? What are the six Cs for successful
implementation of TQM?
(b) What is the concept of Value-chain' and what steps are involved in value chain analysis approach for assessing competitive advantages?
Linear Programing
19. A manufacturer producer two products P1 & P2 with raw material M1 & M2. Requirement and availability of raw material and labour units are given in the following table. Contribution for unit of products are given:
|
Products |
Requirements permit |
Minimum Contribution per day | |
|
P1 |
P2 | ||
|
Material M1 (kg) |
2 |
1 |
18 kg |
|
Material M2 / kg |
1 |
1 |
12 kg |
|
Labour (hr) |
3 |
2 |
34 hours (max available per day) |
|
Contribution per unit |
Rs.50 |
Rs.30 | |
|
How many units of each products should be produced to maximize profit. ? Program Evaluation & Review Technique 20. The following information is given on different activities of a projects: | ||||||||||||||||||||||||||||||||||||
|
(a) Draw the network diagram and show the critical path and expected project length.
(b) Calculate variance of each activity.
(c) Calculate the probability that the project will be completed in 23 weeks. (For Z = 1.920, Probability P = 0.9726)
Transportation Problem
21. A Company has 4 manufacturing plants and 5 warehouses. Raw material cost and manufacturing cost and capacity of different plants are given in Table 1. Table 2 gives the sales price, transportation cost from plants and demand at different warehouse locations.
|
Table 1 | |||||||||||||||||||||||||||||||||||||||||||||||||||||||||||||||||||||||||||||
| |||||||||||||||||||||||||||||||||||||||||||||||||||||||||||||||||||||||||||||
(i) Formulate this into a transportation problem to maximize profit.
(ii) Find the solution using VAM method.
(iii) Test for optimumity and find the optimum solution.
Assignment Problem
22. The following table gives the past performance of five salesman in different regiousin terms of their sales achievement in rupess lakhs.. Find the optimum assignment.
|
Salesman |
R1 |
R2 |
Machine R3 |
R4 |
R5 |
|
S1 |
26 |
14 |
10 |
12 |
9 |
|
S2 |
31 |
27 |
30 |
14 |
16 |
|
S3 |
15 |
18 |
16 |
25 |
30 |
|
S4 |
17 |
12 |
21 |
30 |
25 |
|
S5 |
20 |
19 |
25 |
16 |
10 |
|
23. In a travel agency, servicing clients was observed to follow: | ||||||||||||||||||||||||||||||||||||||||
|
(a) Simulate the arrival of 10 clients and their servicing with the following random numbers.
Arrival pattern: 03, 47, 43, 73, 86, 36, 96, 47, 36, 61.
Service pattern: 63, 71, 62, 33, 26, 16, 80, 45, 60, 11
(b) Calculate the number of the served in a week of 6 days, each day is about 8 hours.. Time Series Forecasting
24. Using additive model, estimate the seasonal indices by the method of moving average from the table given below. Deseasonalise personalize the given production figures with the seasonal indices obtained. Explain the significance of deseasonalised data:
|
Year |
Quarterly output 000 tons | |||
|
Q1 |
Q2 |
Q3 |
Q4 | |
|
2006 |
74 |
76 |
74 |
80 |
|
2007 |
82 |
68 |
50 |
62 |
|
2008 |
70 |
74 |
70 |
82 |
Testing of Hypothesis
25. A briefcase manufacturing Company says that 80% of excutives carried their briefcase. Verify its claim, if in a random sample of 900 executives 675 executives used the company's briefcases. Use 5% test of significance.
|
SUGGESTED ANSWERS / HINTS | |||||||||||||||||||||||||||||||||||||||||||||
|
market.
The plan for manufacturing other components considering the limiting factor is as follows:
X: 3500 units 5250 hrs
Y: 2000 units 4000 hrs
W: 1375 units 2750 hrs
Total 12.000 hrs
Let us calculate cost of manufacturing of balance quantity of W in 2nd shift.
Balance 1625 units of W requires m/c hrs Cost of manufacturing of W per unit Material cost Wage Cost ( rs 30 x 1.2)
3250 hrs
Rs. 60 Rs. 36 Rs. 40 Rs.136
Direct Expenses Total Variable cost
Fixed cost is excluded in calculation because fixed cost is already allocated to product W and for the purpose of decision making here it is a sunk cost.
Variable Cost of production of 1625 units in 2nd shift @ Rs 136
Rs. 2, 21,000 Rs. 12,000 Rs. 2, 33,000 Rs. 2, 43,750
Extra fixed cost for 3250 hrs ( Rs 3000 x 4)
Toal cost of manufacturing 1625 units in 2nd shift
Purchase price for 1625 unit @Rs. 150/- =
Hence, balance quantity of W should be manufactured in the second shift.
Variable Cost for unit of component = Rs.(20.00 + 17.50 + 5.25) = Rs.42.75 which is less than market price and saving per unit will be Rs 2.25.
Hence, the components, may be manufactured in the factory itself.
Present contribution from Mixer-grinder = 20,000 x RS.200 = Rs.40 lakhs
When production and sales go up to 25,000 , sales price of pressure cooker will be reduced Rs 52 per unit.
Contribution per unit will be (Rs.250-52) Additional saving from Component Contribution per unit Total Contribution (Rs 200.25 x 25,000) Less additional Interest on working capital Net Contribution
= Rs.198.00 = Rs. 2.25 = Rs.200.25 = Rs.50,06,250 = Rs 2,40,000 = Rs 47, 66,250
As, the proposal when implemented will enhance the contribution by Rs 7,66,250, the proposal may be accepted.
3.
|
Product A |
Product B |
Total | |
|
Number of Units |
6000 |
16000 | |
|
Contribution per unit |
16 |
24 | |
|
Labour hour per unit |
1 |
1.5 | |
|
Contribution per labour hour |
16 |
16 | |
|
Total Contribution (Rs) |
96,000 |
3,84,000 |
Rs 4,80,000 |
|
Total Labour hours |
6,000 |
24,0000 |
30,000 |
|
Total Fixed Overheads (Rs.) |
48,000 |
1,92,000 |
Rs 2,40,000 |
|
Idle capacity ( labour hours) |
15,000 |
(a) Profitability of the original programme Total Contribution = Rs. 4, 80, 00 Fixed Cost = Rs. 2, 40, 00 Profit = Rs. 2, 40, 00
(b) Evaluations of different proposals
(i) Discontinue A
No. of Product B produced = 6000/ 1.5 = 4,000 units
Contribution from additional units of B ( 4,000 x 24)= Rs.96,000
Contribution forgone on discontinuance = Rs.96,000
Thus, profitability wise it leads to point of indifference. However, other points of production facilities & sales advantages may be taken into consideration.
Discontinue product B & Produce product C Contribution per unit of C Labour hours per unit t Units produced ( 24,000/ 1.25) Contribution (19,200 x Rs 22)
Contribute from A
Rs. 22 1.25 hours 19,200 units Rs. 4,22,400 Rs. 96,000 Rs. 5, 28,400 Rs. 2, 40,000 Rs. ,2, 88,400
Fixed Cost Profit
(iii) Produce D in idle capacity
Contribute per unit of D = Rs. 22
Labour hours per unit = 2.50 hrs
Units produced (15,000/2.5) = 6,000
Contribute from D = Rs 1,32,000
Total contribution from A & B = Rs 4, 80,000
Total contribution from A, B, & D = Rs 6,12,000
Fixed Cost = Rs 3, 10,000
Profit = Rs 3,02,000
(iv) Hiring out of idle capacity of 15,000 Labour capacity
Contribution from renting out = Rs. 60,000
Total contribution from A & B = Rs 4,80,000
Total contribution f = Rs 540,000
Fixed Cost = Rs 2,40,000
Profit = Rs 3,00,000
As profit in proposal (iii) i.e production of D using idle capacity will be maximum, the same is recommended. Moreover, renting out of factory to a third party will curtail the flexibility in future production planning.
Profitability of the next in case of normal production in the next year :
4
Product X Product Y Total
Unit 5000 10000
Selling Price Rs. 1060 Rs.1248
Direct Material 315 525
|
41.30 20.00 21.30 49.50 20.00 29.50 Total | |||||||||||||||||||||||||||||||||||||||||||||||||||||||||||||||||||||||||||||||||||||||||||||
Variable Overheads 262.50 250
Total Variable cost 840 1025
Contribution per unit ( Rs ) 220 175
Total Contribution ( Rs Lakhs) 11.00 32.81 43.81
Fixed Overheads 20.00
Profit for the next year under proposal 23.81
Note : Because of fall in efficiency by 16%, Labour hrs required per unit of B = 2.38 Proposal 3 :
Units of product Z to be produced with idle capacity = 17,500 /3 = 5833 units Variable cost per unit of Z = Rs ( 400 + 315 + 315) = Rs 1030 Contribution per unit of Z = Rs ( 1350 - 1030) = Rs 320 Additional Contribution from 5833 units = Rs 18.66 lakhs.
Less Additional Selling & Dist Cost = Rs 6.50 lakhs Net Contribution from production of Z = Rs 12.16 lakhs Total Profit under proposal 3 = Rs ( 21.30 + 12.16) = Rs 33.46 lakhs.
Hence, proposal 3 should be accepted.
5. (Rs. Lakhs for one lakhs Units)
Direct Material
A 1,00,000 x Rs 25 ( Replacement cost) 25.00
B 60,000 x Rs 10 (old stock at resale value) 6.00
40,000 x Rs 30 (New at replacement cost) 12.00
C 1,00,000 x Rs 60 60.00 103.00
Direct Labour
Skilled labour 25,000 hrs @ Rs.150 37.50
Unskilled labour (nil) - 37.50
Variable overhead Rs.15 x 1,00,000 15.00
Fixed overheads 18.00
Depreciation for M1 ( Rs 16- 13) lakhs 3.00
Depreciation for M2 ( Rs 2.2 - 1.7) ( reduction in resale value) 0.50 3.50
Total Cost 177.00
Old technology Advanced Machine technology Machine
Direct. material per unit Rs. 500 Rs. 502.50
Labour Cost 50 41.67
V. overheads 40% of labour 20 16.70
570 560.87
(Rs. Lakhs) (Rs. Lakhs)
Total variable cost for 3,00,000 unit 1710.00 1682.60
Depreciation 15.00 15.00
Fixed Cost 30.00 32.40
Loss on return of earlier machine 5.00
Bonus earned for 50,000 unit @ 30 - - 15.00
Total Cost 1741.25 1720.00
Taking into wastage, Material Cost per unit = Rs 500 x 1.005 = Rs 502.5
With Efficiency improvement, Labour cost per unit = Rs 50 / 1.20
Average production per month = 30,000 units
Average advance supply per month ( entitled for reward) = 5,000 units
Total advance supply during 10 months ( entitled for reward) = 50,000 units
As there will be gain of Rs. 21.25 lakhs in handling the project with the help of advanced technology machine, the company should go for advanced version machine.
|
7. At 100% capacity. | ||||||||||||||
|
Operation 80% capacity Export order 40% capacity
(Rs. Lakhs) (Rs lakhs)
Prime Cost 57.60 12.00
Factory overhead (given) 21.60 8.40
Selling & Dist. Cost-variable 17.28 -
Selling & Dist. Cost - fixed 7.20 2.00
Total Cost of Sales 103.68 22.40
Sales Value ( at 80% capacity)
115.20
144 x 0.80
Profit 11.52 2.49
Profit % 10% on sales 10% of export sales value
Export Price to be quoted 24.89
Let , Sales value = x , then profit = 0.1x
Then 0.9 x = 22.40
Hence x = 24.89
Variable prod. cost per cartoon = Rs 5,00,000 / 2000 = Rs 250
8
Fixed Production Overheads per Quarters = Rs 2.00 lakhs
Variable Selling & Distribution Expenses per cartoon = 2,00,000/ 2000 = Rs 100
Fixed Selling & Distribution Expenses per Quarters = Rs 1.40 lakhs
For Next year Programme :
Sales targeted for the year = 5000 x 4 x 1.2 = 24,000 cartoons.
|
Variable Prod. cost per cartoon = Rs 250 x 1.10 |
= Rs 275.00 |
|
Variable Selling Exp per cartoon |
= Rs 100.00 |
|
Total Variable cost per cartoon |
= Rs 375.00 |
|
Fixed Production Overheads for the year |
= Rs. 8.00 lakhs |
|
Fixed Selling & Dist Overheads = Rs 1.40 x 1.25 x 4 |
= Rs. 7.00 lakhs |
|
Return on Investment required ( post tax 15%) ( i.e 30 x .3) |
= Rs. 9.00 lakhs |
|
Total Contribution required |
Rs 24.00 lakhs |
|
Contribution required per cartoon = Rs 24,00,000/24000 |
= Rs 100.00 |
|
Thus, Price for product should be = Variable Cost + Contribution |
= Rs 475 |
i.e reduction in price by Rs 25 i.e 5%.
Current Price per unit is Rs 500 Present price per unit
The aggressive move on increase in marketing expenses coupled with price reduction may help in achieving the target of sales and profit..
9. (a) Variable cost per room-day = Rs 75
Total occupancy = (50 x 30 x 8 x 0.8) + (50 x 30 x 4 x 0.5)
= 12,600 room-days Total variable cost = Rs. 9.45 lakhs
(12,600 x 75)
Fixed Cost = Rs. 15.75 lakhs
Total Cost Rs. 25.20 lakhs
Profit Rs. 6.30 lakhs
Rs. 31.50 lakhs
Tariff per day = 31, 50,000/12,600 = Rs. 250.00
(b) Contribution per day = Rs. (250 - 75) = Rs. 175.00 BEP ( room -day) = 15, 75, 000/175 = 9000 room-days
During off season for 4 months, rooms occupied ( 50 x 30 x 4 x .5) = 3,000 days For BEP, occupancy during normal period = 6000 days i.e occupancy 50%
(c) If 10% discount is allowed , tariff will be = 225. per room-day Contribution per room-day with tariff cut ( 225- 75) = Rs 150
Total Occupancy= (50 x 30 x 8 ) + (50 x 30 x 4 x .0.7) = 16,200 room-days Total Contribution for year ( 16,200 x Rs 150) = Rs 24.30 lakhs Fixed Cost ( unchanged) = Rs 15.75 lakhs
Profit = Rs 8.55 lakhs
As the proposal increases the profit, it may be accepted.
(d) To maintain the same profit, contribution required = F + P = Rs 22. 05 lakhs With new tariff, contribution per day = Rs 150
Number of room-days occupied = Rs 22,05,000/ 150 = 14,700 room-days Increase % in occupancy required = ( 14,700 - 12600 ) / 12,600 = 16.67 %
10. Present position on transfer of component at Rs 200:
|
Rupees |
Rs lakhs | ||
|
Division A |
Division B |
AB Ltd | |
|
Contribution per unit |
10 |
400 |
42.00 |
|
Fixed Cost per unit |
20 |
200 |
24.00 |
|
Profit per unit |
-10 |
200 | |
|
Profit |
-2,00,000 |
20,00,000 |
18.00 |
(a) Renting out Division A's facility & and Div B procures components @ Rs 210
A division B division AB Ltd
(Rs) (Rs) (Rs lakhs)
No of Units 10,000
Variable Cost per unit 1120
|
(b) (a) |
| ||||||||||||||||||||||||||||||||||||||||||||||||||||||||||||||||||||||||||||||||||||||||||||||||||||||||||||||||||||||||||||||||||||
|
(c) |
Tax of X division |
252 |
252 |
315 |
350 |
|
(d) |
Tax differential for Y division |
0 |
-50 |
0 |
- 40 |
|
(e) |
Profit differential for XY Ltd |
378 |
398 |
315 |
290 |
|
d + (c - b) + a | |||||
|
Net gain/ loss for XY Ltd |
20 |
- 25 | |||
Thus under scenario 2, the transfer is not advantageous to the company as a whole.
12. Due to cut is price of product, sales value will decrease by Rs 10.00 lakhs.
For maintaining same profit margins i.e Rs 40 lakhs, cost has to be down by Rs 10.00 lakhs. With improvement of labour productivity, wages will be (45/1.20) = Rs 37.50
Rs lakhs
Reduction in wages 7.50.
Elimination of wastage of materials 0.60
Saving in Packaging Cost 1.50
Saving in Maintenance cost 1.20
Loss in disposal of selling of old machine - 2.30
Difference in Depreciation - 1.50
Cost of capital investment - 3.00
Effective cost reduction 4.00
Additional reduction required for target cost 6.00
Hence, number of supervisors to be eliminated = 4
13.
|
March |
April |
May |
June |
July |
Aug | |
|
Sales |
600.00 |
650.00 |
620.00 |
620.00 |
630.00 |
640.00 |
|
Variable cost ( 60% of sales) |
360.00 |
390.00 |
372.00 |
372.00 |
378.00 |
384.00 |
|
Variable cost of actual production( V) | ||||||
|
( 60% of Cur month + 40% of next) |
372.00 |
382.80 |
372.00 |
374.40 |
380.40 | |
|
Material Cost of actual prod ( V x 0.6) |
223.20 |
229.68 |
223.20 |
224.64 |
228.24 | |
|
Actual Material Procured ( M) | ||||||
|
50% of Current month + 50% of next |
226.44 |
226.44 |
223.92 |
226.44 | ||
|
Labour cost of actual production ( L) |
111.60 |
114.84 |
111.60 |
112.32 | ||
|
Variable Overheads (VO) |
37.20 |
38.28 |
37.20 |
37.44 | ||
|
Fixed Overheads ( FO) |
25 |
25 |
25 | |||
|
Depreciation ( D) |
1.2 |
1.2 |
1.2 |
Total | ||
|
Total cost ( V + FO+D) |
409.00 |
398.20 |
400.60 |
1207.80 |
(c)
11.
Closing balance of production 148.80
at variable cost
Closing balance of material 111.60
112.32
(a) Statement for the period of quarter : April- june 2010 Total Sales
1890.00
1468.20
421.80
262.08
683.88
Opening balance of production 148.80 Opening balance of material 111.60 260.40 Cost of Production 1207.80
Closing Balance of production 149.76 Closing balance of material 112.32 Profit
Note 1 : Opening Balance & Closing Balance at Variable cost Note 2 : Adjustment for variable cost expenses not done
|
(b) |
| ||||||||||||||||||||||||||||||||||||||||||||||||||||||||
(Rs.'000)
14.
|
Standard Cost |
Adjustment Variance |
Actual Cost | |
|
Direct Material Cost (14,000 x 450) |
6480 | ||
|
Material Price Variance (A) |
+ 425 | ||
|
Material Usage Variance (F) |
- 105 | ||
|
Actual Material Cost |
6800 |
Direct Labour Cost (14,400 x 300) 4320
Labour Rate Variance (A) + 400
Labour Efficiency Variance (F) - 320
Actual Labour Cost 4400
Direct Expenses (14,400 x 50) 720 720
Actual Prime Cost 11920
Variable factory overhead (14,400 x 25) 360 Variable Expenditure Variance - 40
Actual Variable Overheads 320
Fixed Factory Overhead (14,400 x 30) 432
Fixed Volume Variance (A) + 168
Fixed Expenditure Variance (F) - 40
Actual Fixed overhead 560
Administrative overhead (14,400 x 30) 432
Adm. Expenditure Variance (A) + 40
Adm. Volume Variance (A) + 168
Actual Administrative Overhead 640
Total Actual Cost 13440
Sales (14,400 x Rs.1,000) 14400
Actual Profit 9600
15. Total Production Overheads = Rs 1,67,400
Total Machine Hours = ( 720 x 4 ) + (600 x 2) + (480 x 2) + ( 502 x 2) = 6144 hrs Production Overheads per Machine Hours = Rs 172,032/ 6144 = Rs 28 Thus, cost per unit in the present system :
|
A |
B |
C |
D | |
|
Direct Material |
162 |
105 |
125 |
108 |
|
Direct Wages |
70 |
75 |
60 |
80 |
|
Production Overheads |
112 |
84 |
56 |
28 |
|
Total Cost |
344 |
264 |
241 |
216 |
Production Run = No of Requisition = ( 720 + 600 + 480 + 504 ) / 24 = 96 No of orders = 2304 / 12 = 192 No of Requisitions = 50 x 4 = 200
Machine Operation Cost ( Rs 94,500) will be distributed to Set Up, Stores and Inspection in the ratio of 4:3:2 . Thus their shares are : Rs 42,000, Rs 31,500, 21,000
|
Activities |
Cost Driver |
Cost per unit | ||
|
of Cost Driver | ||||
|
Set Up Cost ( 42,000 + 40,000) = Rs 82,000 |
96 |
Rs 854.17 | ||
|
Stores Receiving ( 31,500 + 15,000) = Rs 46,500 |
200 |
Rs 232.50 | ||
|
Inspection ( 21,000 + 10,000 ) = Rs 31,000 |
96 |
Rs 322.92 | ||
|
Material Handling Rs 12532 |
192 |
Rs 65.27 | ||
|
Thus, Cost of activities on the basis of Activity Costing : | ||||
|
A |
B |
C |
D | |
|
No of Unit |
720 |
600 |
480 |
504 |
|
Production Run |
30 |
25 |
20 |
21 |
|
No of Requisition |
50 |
50 |
50 |
50 |
|
No Of Order |
60 |
50 |
40 |
42 |
|
A |
B |
C |
D | |
|
Set up Cost |
25625.10 |
21354.25 |
17083.40 |
17937.57 |
|
Stores Receiving |
11625.00 |
11625.00 |
11625.00 |
11625.00 |
|
Inspection |
9687.60 |
8073.00 |
6458.40 |
6781.32 |
|
Material Handling |
3916.20 |
3263.50 |
2610.80 |
2741.34 |
|
Total |
50853.90 |
44315.75 |
37777.60 |
39085.23 |
|
70.63042 |
73.85958 |
78.70333 |
77.55006 | |
|
Direct Material / Unit |
162.00 |
105.00 |
125.00 |
108.00 |
|
Direct Labour / Unit |
70.00 |
75.00 |
60.00 |
80.00 |
|
Overheads Per Unit |
70.63 |
73.86 |
78.70 |
77.55 |
|
Total Cost /Unit According to ABC |
302.63 |
253.86 |
263.70 |
265.55 |
|
Total Cost according to present system |
344.00 |
264.00 |
241.00 |
216.00 |
|
Difference |
+41.37 |
+10.14 |
-22.70 |
-49.55 |
The distribution of overhead under present system on an arbitrary basis distorts apportionment of overheads and thereby misleads calculation of costs of products and decision making. Cost of A & B are shown higher whereas in the case of C & D, costs are shown lower. Differences in cases of A & D are huge.
16. Average labour cost for first 50 units = Rs 100.00
Average labour cost for first 100 units = 0.90 x 100 = Rs 90 Average labour cost for first 200 units = 0.90 x 90 = Rs 81 Average labour cost for first 400 units = 0.90 x 81 = Rs 72.90 Average labour cost for first 800 units = 0.90 x72.90 = Rs 65.61 We know that learning curve equation :
Y= ax Ab
Where y = average time for producing x units a = time spent on first unit / batch b= co-efficient of learning curve
b= log ( 1 - % decrease) / Log 2 = log ( 1 - 0.10) / log 2 = - 0.0458/0.3010 =- 0.15206 Thus, for 1000 units, batch = 1000/50 = 20 Y= 100 x 20 a-0.15206
Log y= log (100) - 0.15206( log 20) = 2 - 15206 x 1.3010 = 1.802172
Thus y = antilog (1.802172) = 63.41
Thus, average labour cost for 1000 units = Rs 63.41
Thus the price to be quoted :
|
First 400 |
First 800 |
First 1000 | |
|
units (Rs ) |
units ( Rs) |
unit ( Rs) | |
|
Material @ Rs 150 |
60000 |
120000 |
150000 |
|
Labour Cost |
29160 |
52488 |
63410 |
|
Overheads |
20000 |
40000 |
50000 |
|
Total Cost |
109160 |
212488 |
263410 |
|
Profit |
27290 |
53122 |
65852 |
|
Price to be quoted |
136450 |
265610 |
329262 |
17. (a) Backflushing requires no data entry of any kind until a finished product is completed. At that time the total amount finished is entered into the computer system, which multiples it by all the components listed in the bill of materials for each item produced. This yields a lengthy list of components that should have been used in the production process and which is subtracted from the beginning inventory balance to arrive at the amount of inventory that should now be left of hand. Back the entire production process. Given the large transaction volumes associated with JIT, this is an ideal solution to the problem.
The following problems must be corrected before it will work properly:
(i) Production reporting
(ii) Scrap reporting
(iii) Lot tracing
(iv) Inventory accuracy.
(b) Target Costing: It is a management tool used for reducing a product cost over its entire life cycle. It is driven by external Market factors. Marketing management prior to designing and introducing a new product determines a target market price. This target price is set at a level that will permit the company to achieve a desired market share and sales volume. A desired profit margin is then deducted to determine the target maximum allowable product cost. Target costing also develops methods for achieving those targets and means to test the cost effectiveness of different cost-cutting scenarios.
Target Costing Process
18. (a) The total quality management is a set of concepts and tools for getting all employees focused on continuous improvement in the eyes of the customer. Quality is an important aspect of world-class manufacturing. The success of Japanese companies is grass rooted in their long-term commitment to improvement of quality. A world class manufacturing approach demands that the quality must be designed into product and the production process, rather than an attempt to remove poor
quality by inspection. This means that the objectives of quality assurance in a world-class-manufacturing environment, is not just reject defective product, but to systematically investigate the cause of defects so that they can be gradually eliminated. Though the goal is zero defect, the methodology is one of continuous improvement.
Six Cs of TQM
(i) Commitment - If a TQM culture is to be developed, so that quality improvement becomes normal part of everyone's job, a clear commitment, from the top must be provided. Without this all else fails.
(ii) Culture - Training lies at the centre of effecting a change -in culture and attitudes. Negative perceptions must be changed to encourage individual contributions.
(iii) Continuous improvement - TQM is a process, not a program, necessitating that we are committed in the long term to the never ending search for ways to do the job better.
(iv) Co-operation: The on-the-job experience of all employees must be fully utilized and their involvement and co-operation sought in the development of improvement strategies and associated performance measures.
(v) Customer focus: Perfect service with zero defects in all that is acceptable at either internal or external levels.
(vi) Control: Documentation, procedures and awareness of current best practice are essential if TQM implementations are to function appropriately The need for control mechanisms is frequently overlooked, in practice.
(b) Value chain is the linked set of value creating activities from the basic raw materials and components sources to the ultimate end use of the product or service delivered to the customer.
The six business functions contained in the value chain are (i) Research and Development, (ii) Design (iii) Production (iv) Marketing (v) Distribution and (vi) Customer service.
Most corporations define their mission as one of creating products and services. In contrast, the other companies are acutely aware of the strategic importance of individual activities within their value chain, They are concentrating on those activities that allow them to capture maximum value for their customers and themselves.
These firms use the value chain analysis approach to better understand which segments, distribution channels, price points. product differentiation. selling prepositions and value chain configuration will yield them the greatest competitive advantage.
The way the value chain approach helps these organizations to assess competitive advantage includes the use of following steps of analysis.
(i) Internal cost analysis - to determine the sources of profitability and the relative cost positions of internal value creating processes;
(ii) Internal differentiation analysis - to understand the sources of differentiation with internal value-creating process; and
(iii) Vertical linkage analysis - to understand the relationships and associated costs among external suppliers and customers in order to maximize the value delivered to customers and to minimize the cost.
The value chain approach used for assessing competitive advantages is an integral part of the strategic planning process. Like strategic planning, value chain analysis is a continuous process of gathering, evaluating and communicating information for business decision-making.
|
19. We solve the problem with graphical method. |
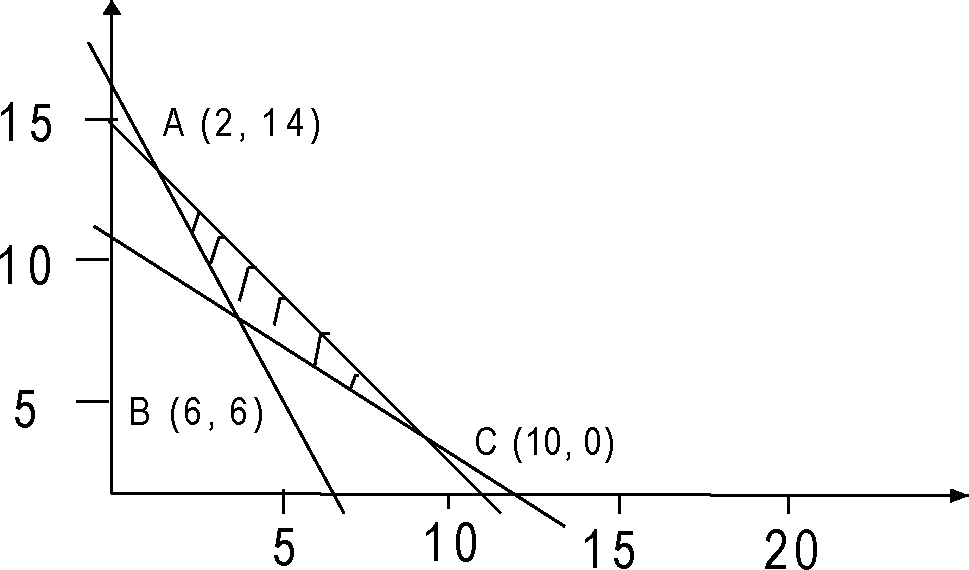 |
Mathematical formulation of the problem : Maximize Z = 50x, + 30x2 Subject to constraints:
2x1 + x2 > 18 x1 + x2 > 12 3x1 + 2x2 34 Co-ordinate of extreme points A (2, 14), B (6, 6), C (10, 2)
At A (2, 14), Z-= 50 x 2 + 30 x 14 = 520 At B (6, 6), Z = 50 x 6 + 30 x 6 = 480 At C (10, 2), Z = 50 x 10 + 30 x 2 = 560 Thus solution is x1 = 10, x2 = 2, max Z = 560
|
Activity |
t0 |
tm |
tp |
1 t6= ~ (to+4tm+tp) 6 |
a2= (tp- 6 to)2 |
|
1 - 2 |
3 |
3 |
3 |
3 |
0 |
|
3 - 2 |
3 |
6 |
9 |
6 |
1 |
|
4 - 2 |
2 |
4 |
6 |
4 |
4/9 |
|
5 - 3 |
4 |
6 |
8 |
6 |
4/9 |
|
6 - 4 |
4 |
6 |
8 |
6 |
4/9 |
|
5- 6 |
0 |
0 |
0 |
0 |
0 |
|
7 - 5 |
3 |
4 |
5 |
4 |
1/9 |
|
6- 7 |
2 |
5 |
8 |
5 |
1 |
(b)
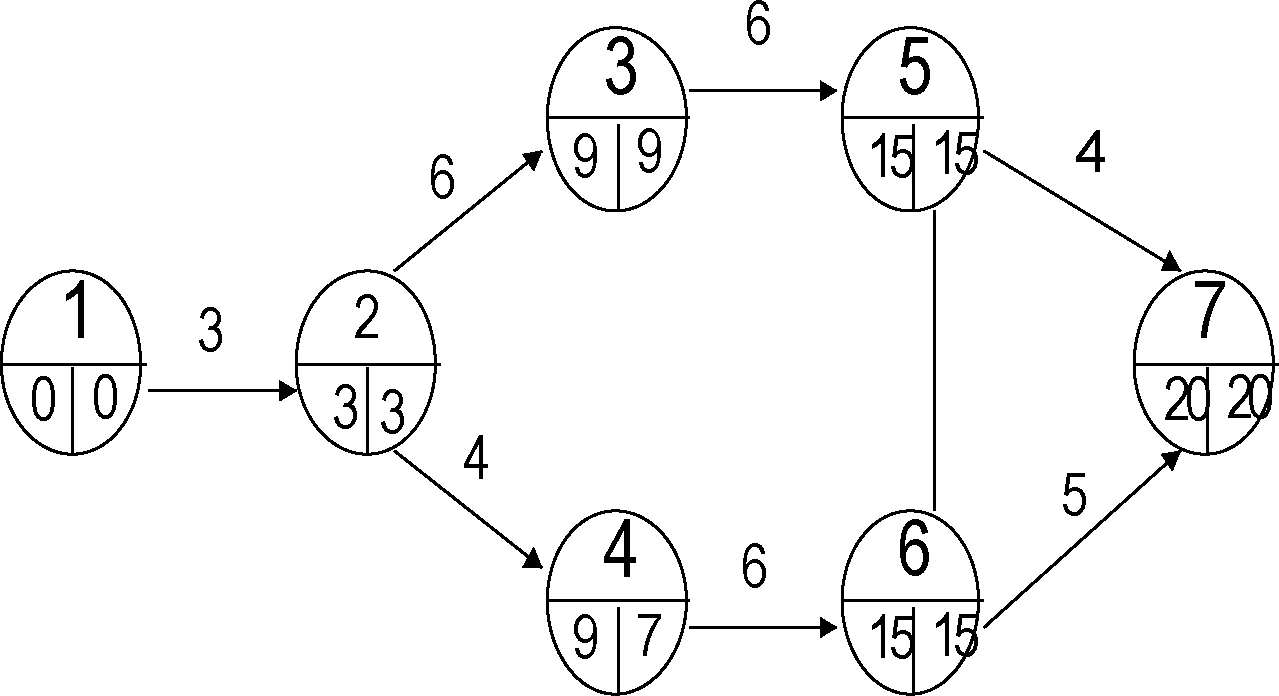
Critical path : 1 - 2 - 3 - 5 - 6 - 7 Expected project length = 20 weeks.
Variance in project = c2 = 0+1 + 4/9 + 0 + 1 = 2.444
(c) Probability that the project will be completed in 23 weeks
(
A
P
V2444
P (0< Z < 1.920) = 0.9726, 97.26%
23 - 20
0 < Z <
21. Based on the given data, profit matrix is derived by the equation is drawn below : Profit = Sales price - production cost - raw material cost - transportation cost
|
Warehouse |
1 |
Profit (Rs. 2 3 |
Per unit) 4 |
Dummy |
Demand |
|
A |
6 |
6 11 |
15 |
0 |
80 |
|
B |
4 |
10 6 |
12 |
0 |
120 |
|
C |
6 |
7 4 |
6 |
0 |
150 |
|
D |
4 |
4 0 |
14 |
0 |
70 |
|
E |
8 |
7 8 |
9 |
0 |
90 |
|
Supply |
100 |
0 2 0 0 2 |
80 |
10 |
510 |
Problem is on maximization of profit. We have to convert the same to minimization one by drawing an equivalent minimization of loss by subtracting all the profit values in the table from the highest profit value (i.e., 15). We apply Vogel's method to find the initial basic feasible solution as shown in table 3 below:
|
TABLE 3: INITIAL BASIC FEASIBLE SOLUTION - VAM | ||||||||||||||||||||||||||||||||||||||||||||||||||||||||||||||||||||||||||||||||||||||||||||||||||||||||||||||||||||||||||||||||||||||||||||||||||||||||||||
| ||||||||||||||||||||||||||||||||||||||||||||||||||||||||||||||||||||||||||||||||||||||||||||||||||||||||||||||||||||||||||||||||||||||||||||||||||||||||||||
Since the number of occupied cells are 8 which is one less than the required number m + n - 1 = 9, the solution is degenerate and after making an allocation of e the cell (D, 4), the initial solution is tested for optimumity in table 4 using MODI method.
Warehouse
Plants
Demand u
Dummy
1
2
3
4
9
9
4
0
15
A
u1
7
80
7
5
4
7
11
9
5
3
15
B
120
u2
2
70
50
4
(-)
-2
(+)
2
9
11
8
9
15
C
150
u3
0
100
40
10
1
2
11
5
1
1
15
D
70
u3
6
70
8
0
(+)
(-)
6
7
7
8
6
15
E
90
u3
4
90
4
5
3
4
Supply
100
200
120
10
510
V2 = 11
V4 = 7
v5 = 15
v
Since the cell (B, 4) has the negative opportunity cost (i.e., -2), it is admitted as an entering variable (cell) in the solution. On constructing closed loop or path, we find that e units should be shipped from (B, 3) or (D, 4) to (B, 4). This yields the solution as given in table 5.
Warehouse
Plants
Demand
A
80
U1 = 6
80
11
9
5
3
15
120
U2 = 9
B
70
50
4
(-)
2
9
11
9
15
C
150
us =11
100
40
10
1
4
11
5
1
15
D
70
U3 = 5
70
8
0
2
6
7
7
8
6
15
90
U3 = 7
E
90
2
5
5
4
Supply
100
200
120
80
10
510
V1 = -2
V2 = 0
V3 = -4
V4 = -6
V5 = 4
V
Table 5 gives optimum solution.
Maximum Profit = 15 x 80 + 6 x 70 = 10X 50 + 6 x 100 + 4 x 40 + 14 x 70 + 8 x 90 = Rs 4580
22. Step 1: The problem is for maximization of objective function. We have to convert it to a minimization one (is assignment algorithm is for minimization) of subtracting all elements from maximization element 31.
| ||||||||||||||||||||||||||||||||||||||||||||||||||||||||||||||||||||||||||||||||||||||||||
|
Step 3: Column subtraction & drawing straight lines to cut all 280 elements. | ||||||||||||||||||||||||||||||||||||||||||||||||||||||||||||||||||||||||||||||||||||||||||
Regions
R1
0
R3
16
17
Cr-
-t-
-14-
17
1
-4-
14
0
Salesman
51
52
53
54
55
|
Step 4: Since the member of lines are 5, the optimality criteria is satisfied. | ||||||||||||||||||||||||||||||||||||||||||
| ||||||||||||||||||||||||||||||||||||||||||
|
Optimum Salesman |
Assignment Region |
Sales |
|
S1 |
R1 |
26 |
|
S2 |
R2 |
27 |
|
S3 |
R5 |
30 |
|
S4 |
R4 |
30 |
|
S5 |
R3 |
25 |
|
Total |
138 | |
|
Table 1 Time to deal with clients | |||||||||||||||||||||||||||||||||||||||||||||||||||||||||||||||||||||||||||||||||||||||||||||||||||||||||||||||||||||||||||||||||||||||||||||||||||||||||||||||||||||||||||||||||||||||||||||||||||||||||||||||||||||||||||||||||||||||||||||||||||||||||||||||||||||||||||||||||||||||||||||||||||||||||||||||||||||||||||||||||||||||||||||||||||||||||||||||||||
For 10 Clients, service time = 122 mins = 2 hours 2 mins 40 clients can be served in a day of extended day of 8 hours and 8 minutes. According to simulation in 6 days a week No. of clients may be served = 6 X 40 = 240. 24. At first Trend (T) is estimated by taking moving average for the period of 4 quarters. It is then eliminated from the original date by subtraction. Y- T = (T + S + C + I)- T = S + C + I When these deviation from trend' are averaged for each quarter, the cyclical (c) and irregular (I) components are removed to a large extent. This leaves only seasonals (S), which are suitably adjusted.
indices are used for deseasonalisation with the formula x 100. S
The significance of deseanalisation of data is to take care of deviations due to variation of climate, change in season, festivals, custom etc. 25. Null Hypothesis Ho : p = 80% n = 900 p = portion of executives using company's briefcase = 675 / 900 = 0.75 Population proportion P = 0.80 Z = ( 0.075- 0.80 ) / SE of p = - 0.05 / V(0.80 x0.20) /900 = - (0.05 x 30) / 0.4 = - 1.5 / 0.4 = -3.75 Critical value of Z at 95% level of confidence = 1.96 As I Z I > 1.96, Ho is rejected. 38
You are here:
PAPER
| |||||||||||||||||||||||||||||||||||||||||||||||||||||||||||||||||||||||||||||||||||||||||||||||||||||||||||||||||||||||||||||||||||||||||||||||||||||||||||||||||||||||||||||||||||||||||||||||||||||||||||||||||||||||||||||||||||||||||||||||||||||||||||||||||||||||||||||||||||||||||||||||||||||||||||||||||||||||||||||||||||||||||||||||||||||||||||||||||||