The Institute of Chartered Financial Analysts of India University 2010 C.A Chartered Accountant Final Revision Test s- 5 – Cost Management (old ) - Question Paper
May 2010: The Institute of Chartered Accountants of India - Revision Test ques. papers (RTPs) Final Examination: Paper five Cost Management (old course): May 2010 University ques. paper
PAPER - 5 : COST MANAGEMENT QUESTIONS
Basic Cost Concepts for Decision Making: Application of Differential Cost Techniques in Managerial Decision
1. Your Company received an export offer from an potential foreign company for 20,000 units of a special product P @ Rs 1800 per unit.. Cost and other information for the production of the same is given below :
(i) Material Required per unit : 3 kg of X and 2 litres of Y Cost of Material per unit : X Y Book value ( Rs) 80 300 Replacement ( Rs) 100 320 Net Realizable 90 250
Material X is regularly used in the production process whereas 10,000 kg stock of Material Y is lying in stock which is to be disposed, if not used in the current year.
(ii) Labour : Skilled 2 hours @ Rs 150 and unskilled 4 hours @ Rs 100 Skilled work-force is permanent in nature and underutilized.
Unskilled workers are to be hired on per hour basis.
(iii) If the order is accepted, the production of one existing product R is to be curtailed by 5000 units. Information on price and cost of per unit of R is as follows :
Sales Price : Rs 1000
Material : : Rs 200
Unskilled Labour of 4 hours
There will be saving on fixed overhead on the basis of labour hours.
(iv) Variable Overhead is charged @ Rs 30 per hour
(v) Fixed Overhead for the whole year is estimated to Rs 60 lakhs and the productive labour hour for the year is estimated to be 3 lakhs.
(vi) Additional Fixed Overhead of Rs 20.00 lakhs will be incurred for special order.
Required to calculate the profitability of the special order based on i) historical costing system and ii) =elevant costing system
Marginal Costing - Optimum Product Mix
2. A Company Produces three products, details of costs & sales Value per unit is given below
|
Products ( Rs / Unit) | ||||||||||||||||||||
|
(i) 80% of Direct Material is imported @ Rs 500 per kg. Import is restricted to 5,000 kg.
(ii) Capacity avaiable for production of A and C is restricted to 6250 and 6000 hrs respectively.
(iii) Fixed Cost is Rs 20 lakhs.
(a) Workout most profitable product mix and profit.
(iv) Company identifies a source of alternative material as replacement of imported material. Availability of material will not be restricted but carrying cost will be @ Rs 2.75 per kg.
The company plans to modify its process to suit the new material and enhance its capacity for all products by 20% above the present one with an investment of Rs 25 lakhs at an interest of cost of 15%. Company expects 30% rise in is profit.
(b) Find out the price the company can pay to alternative source.
Decision Making : Make Or Buy
3. A Company is engaged in production of Electronic gadget and produces 5,000 units per annum. It also produces 17,000 units of components. Cost of Manufacturing is given below :
|
Manufacturing Cost |
Total Rs Lakhs |
Share of Component Production |
|
Direct Material |
80.00 |
10% |
|
Direct Labour |
18.00 |
25% |
|
Indirect Labour |
10.00 |
30% |
|
Inspection & testing |
6.00 |
20% |
|
Power |
3.00 |
10% |
|
Lighting |
1.00 |
10% |
|
Insurane |
0.96 | |
|
Depreciation |
2.44 | |
|
Misc Fixed Expenses |
4.00 |
(a) Maket Price of the component is Rs 120. Decide whether component to make.
(b) Company received an offer of additional 1000 units of gadgets @ Rs 2500/unit. If offer is accepted, full capacity will be utilized and production of components is to be withdrawn. Decide whether the offer is to accepted.
Shut Down of Operation or Continue
4. A Company manufactures has normal capacity of production of 20,000 units of Product P . Due to Trade depression, it is expected that only 2,000 units can be produced and sold in the next quarter of the year @ Rs 1,000 per unit. Variable cost per unit is Rs 900 and fixed cost for the year is Rs 14 lakhs. The Company plans to shut down the plant and it is estimated that fixed cost for the quarter could be brought down to 1.00 lakhs. Additional cost of shut down is estimated to be Rs 40,000.
(a) Decide whether the plant is to be shut down or not.
(b) Calculate the shutdown point
(c) What are other factors to be considered in the decision of shut down Profit Optimization - Decision Making
5. ABC Ltd is producing following four products, sales and costs for last year is given below:
Rs Lakhs
|
Products ------ |
A |
B |
C |
D |
|
Sales |
500 |
600 |
240 |
200 |
|
Direct Material |
160 |
180 |
68 |
110 |
|
Direct Wages |
100 |
120 |
64 |
56 |
|
Factory Overheads |
80 |
70 |
54 |
30 |
|
Selling & Dist Overheads |
40 |
50 |
20 |
35 |
|
Total cost |
380 |
420 |
206 |
231 |
|
Profit |
120 |
180 |
34 |
-31 |
Total Profit is Rs 303 lakhs.
(i) Present production is much below the capacity. There is market demand of Products A and B and the management likes to enhance production of both A & B by 30%.
(ii) Management proposes to discontinue product D as it is loss making. However, sale of product C is in conjunction with D and D's discontinuance will affect sale of C by 25%.
(iii) 50% of Factory Overheads is variable and variable Selling & Dist. Overheads is 5% of sales. In case of Increase of Production of A & B as above in (i), Fixed Factory Overheads apportioned to A and B will rise by 25% and 20% respectively.
On discontinuance of D, Fixed Factory Overhead for product D can be eliminated by 70% and its portion of Selling & Dist Overhead can be avoided totally.
(a) Suggest whether Product D is to be discontinued.
(b) What will be profitability after enhancement of production of A & B ?
Product Pricing
6. AB Company has two departments producing several small electronic components. It has acquired a new technology to produce a electronic product X . Cost and other information for manufacturing X are given below :
|
Item Direct Material Direct Labour Variable Overhead per hour Fixed Overheads per hour ( based on 100% capacity) Value of Machinery on revaluation |
Department A Rs 240 2 hours @ Rs 120 Rs 50 Rs 60 Rs 40 lakhs |
Department B Rs 200 3 hours @ Rs 100 Rs 30 Rs 40 Rs 28 lakhs |
(i) Technology cost Rs 25 lakhs and working capital requirement Rs 7 lakhs
(ii) Target Volume of production in the first year is 2000 units at 25% capacity
(iii) Variable Selling & Distribution .is Rs 3 lakhs
(iv) Expected net return on investment is 24%
Suggest on pricing product as (a) new one (b) established one - production at 80% capacity.
Costing of Service Sector
7. A Health Care Centre has been established 30 beds and the following variable and fixed cost for the whole year is estimated.
|
Variable Cost |
Rs 000 |
Fixed Cost |
Rs 000 |
|
Doctors' fees |
900 |
Salary of nurses & staff |
670 |
|
Food |
200 |
Rent |
900 |
|
Laundry |
34 |
Repair & maint |
100 |
|
- |
General Administration |
96 | |
|
Total |
1134 |
Total |
1766 |
(i) Health centre was open for 365 days.
(ii) Occupancy : 165 days - full, 100 days - 25 patients and balance 20 average
(iii) Cost of X-ray, Oxygen, Medicine are charged extra by a service agency..
(iv) Profit to be charged 30% above the cost.
(a) Calculate the Charge per patient-day, BEP Patient days.
(b) If BEP point is to be at 50% occupancy, what should be charge per patient-day?
Transfer Price
| ||||||||||||||||||||||||||||
|
Division B requires 300 units of Y. Similar product is procured by it @ Rs 430. |
Division A operates as a profit centre. Work out a transfer price not affecting Division A, if labour hours available to division A are( i) 4400 hours (ii) 5900 hours
Activity Based Costing
9. ABC Ltd is manufacturing 4 similar products W, X, Y, Z with the following details :
| ||||||||||||||||||||||||||||||||||||||||
|
Set up cost is Rs 9000, Purchase Ordering Cost Rs 10,400, Handling Cost Rs 6000 and other factory overheads is Rs 1,27,000 |
In present system, total overheads are charged to production on machine hour basis.
Apply Activity based costing on the basis of relevant cost drivers and indicate the difference in cost of products under the two methods.
Material Procurement and Cash Budget
10. The budgeted stock and sales position for five months Dec 2009 - April 2010 are given below:
|
( Rs lakhs): | ||||||||||||||||||
| ||||||||||||||||||
|
(i) Opening Stock is maintained at 30% of material requirement of current month's |
material requirement. Material is purchased at one month's credit.
(ii) Wages, Rent and Administraive Expenses per month is Rs 3, 4 & 2 lakhs respectively.
(iii) Admin Expenses are paid during current month whereas wages and rent in the next.
(iv) Depreciation is 10% on equipment of book value of Rs 120 lakhs Profit is 25% on sales.
(v) Credit sales is for one month & cash balance at end of December was 8 lakhs. Instalment of Interest on loan @ Rs 4 lakhs is paid every month.
(a) Prepare Material Procurement budget for 4 months : Dec 2009 Jan- March 2010.
(b) Prepare Cash Budget for 3 months : Jan - March 2010.
Budgeting
11. ABC Ltd has, over the past few years, has sales of Rs 400 lakhs with 30% contribution.
Last year's fixed cost was Rs 45 lakhs. Company plans to venture into new contract service business and also in the process of introduction of a new product.
(i) Proposal A : Value of Rs 30 lakhs with variable cost 60%, fixed cost of Rs 4 laks Proposal B : Value of Rs 20 lakhs with variable cost 50%, fixed cost Rs 3 lakhs
(ii) New product : Expected Sales per month 6 lakh with 50% variable cost and fixed cost of Rs 1.0 lakhs per month.
(iii) Optimistic assumption : Offer for both Contract A & B will mature and be executed next year and new product will be launched from 2nd quarter of next year.
(iv) Pessimistic assumption : Only Contract A will mature and be executed next year and new product will be launched from 4th quarters of next year and there will be rise in both variable and fixed cost by 10% without scope for rise in sales value.
Prepare two budgets based on optimistic and pessimistic assumptions.
Profit Planning
12. A Company is manufacturing car components to be supplied to a car Manufacturer. For the current year, material cost per unit is Rs 100, Direct Wages Rs 40 and direct expenses Rs 10 The other information are as follows :
|
Semi-variable cost ( Rs lakhs) at different levels of production | ||||||||||||||||||||
|
Fixed Expenses ( Depreciation, Maintenance etc) = Rs 5.50 lakhs per year.
The company is , at present, supplying 20,000 at a price of Rs 200 expecting order of higher size at the same price. The plant has maximum capacity of producing 30,000 units. It has come to an understanding with the supplier that 1% discount in price ( on present price) will be there for increase in size by each 5% from the present order. Direct Wages will increase by 5% next year. Moreover, the fixed overheads may increase by 5% for each increase in volume of production by 10% or part thereof. The marketing department assessed the probabilities of different order size :
Order Size Probability
20.000 0.35
25.000 0.50
30.000 0.15
Prepare a budgeted profit for the next year on sale based on assessed probability with a comparison with the current year's expected profit .
Variance Analysis
13. EXEL Company is following JIT system for inventory management and it is expected that there will be no opening and closing balance for January 2010. Budgeted production of its product X during the month is 600 kg with the following standard cost per unit :
Rs
Direct Material 4 kg @ Rs 40 per kg : 160.00
Direct Wages 1.0 hours @ Rs 100 per hour : 100.00
Variable overheads 1 hour @ 30 : 30.00
Fixed Overheads 1 hour @ 50 : 50.00
Standard Cost 340.00
Standard Profit 60.00
Standard Selling Price 400.00 Actual Expenses :
(i) Material 2380 kg kg at a total cost of Rs 99,960
(ii) Labour 580 hours at a cost of Rs 56840
(iii) Actual Operating Hours is 550.
(iv) Variable Overheads of Rs 19,200
(v) Fixed Overheads of Rs 31,500
(vi) Selling and Administrative Expenses Rs 5,400
(vii) Output of 585 kg was sold for Rs 2,28,150.
(a) Calculate all variances and (b) Draw an operating statement for Jan 2010. Decision Making on Acceptance of an Order
14. A Company had the following budget of operation & profit for the current year :
Rs Lakhs
Sales 50.00
Direct Material 20.00
Direct Labour 10.00
Factory Overheads - variable 2.00
Factory Overheads - Fixed 2.00
Administrative expenses 3.00
Sales commission 1.00
Fixed Sales Expenses 2.00
Total Costs 40.00
Profit 10.00
For fixing prices, the company charges overheads as 100% of Direct wages. It is reviewed at the fourth quarter that the company would achieve the target of normal sales and profit. However, a special order has been received from a prospective customer valued Rs 2.00 lakhs which involves no sales commission. However, it is estimated that material requirement will be of Rs 1,00,000 and wages will be Rs 60,000.
As total cost of the order taking overheads @ 100% wages is more than Rs 2.00 lakhs, the company is hesitant to accept the order. As an accountant, give your suggestion.
Decision Making
15. AB Ltd produces two products A and B, some deatails of which are given below :
A B
Budgeted Selling Price Rs 3600 Rs 4300
Variable Production & selling cost Rs 2700 Rs 3700
Total Fixed Cost is Rs 18 lakhs
For effective selling, Marketing team has given two options for combined sale of products.
Option 1 : A & B in the proportion of 2: 3 Option 2: A & B in the proportion of 3: 4 Suggest the best option.
Learning Curve Theory
16. In your company, production manager has observed that learning curve theory is very much applicable in the newly procured machine @ 90%. A batch of production is of 100 units. The average labour cost for the first batch is Rs 200. Material Cost and Overheads are Rs 150 and 50 per unit respectively. If profit margin is 25% on cost, estimate the price per unit if the order size is for (a) 800 units and (b) 1600 units ( c) 2000 units
Life Cycle Costing : Introduction and Benefits
17. (a) What is life cycle costing ? What are the benefits of the technique ?
(b) What is theory of constraints ? What are key measures suggested by it ?
Value Chain Analysis : Definition and Competitive Advantage
18. What is value Chain Analysis ? How Value Chain Approach helps in assessing competitive advantage ?
Linear Programming
19. A Company produces three product P, Q, R with raw material M1 & M2. Requirement and availability raw material and labour units are given in the following table. Contribution per unit of the products are given:
| ||||||||||||||||||||||||||||
|
Formulate this as a Linen Programming problem and solve it to determine optimum product mix. | ||||||||||||||||||||||||||||
|
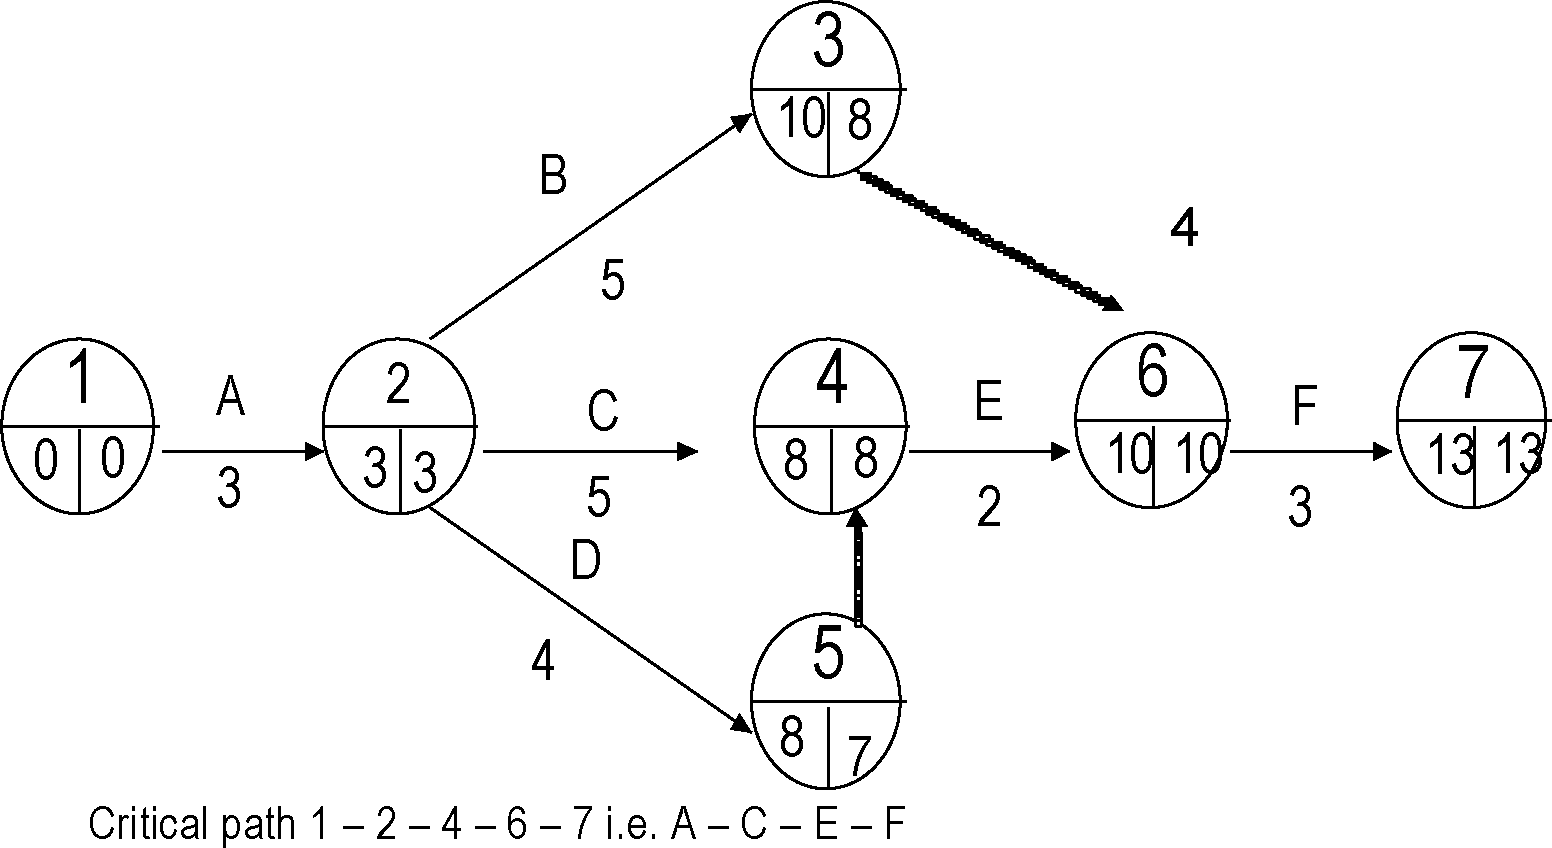
Programme Evaluation and Review Technique 20. ABC Construction Company has the following 6 activities relating to a project: | ||||||||||||||||||||||||||||||||||||
| ||||||||||||||||||||||||||||||||||||
|
C |
3 |
5 |
7 |
16,000 |
22,000 |
A |
|
D |
2 |
4 |
6 |
8,000 |
10,000 |
A |
|
E |
1 |
2 |
3 |
6,000 |
7,500 |
C D |
|
F |
1 |
3 |
5 |
14,000 |
20,000 |
B E |
Penalty for delay in competition of project beyond ten weeks is Rs.2,500.
a. Constrict the PERT Network and determine critical path.
b. Crash the activity sin order to achieve the optimum cost for completion of the project.
Transportation Problem
|
21. A Fertilize Company has the following production in its four plants with following production capacity : | ||||||||||
|
The company has three Distribution centres located at places P, Q and R. The capacity of warehouses at these places and the and the cost of transportation from different plants to these warehouses are indicated given below:
| ||||||||||||||||||||||||
|
Devise distribution plan to optimize transportation cost. |
Assignment Problem
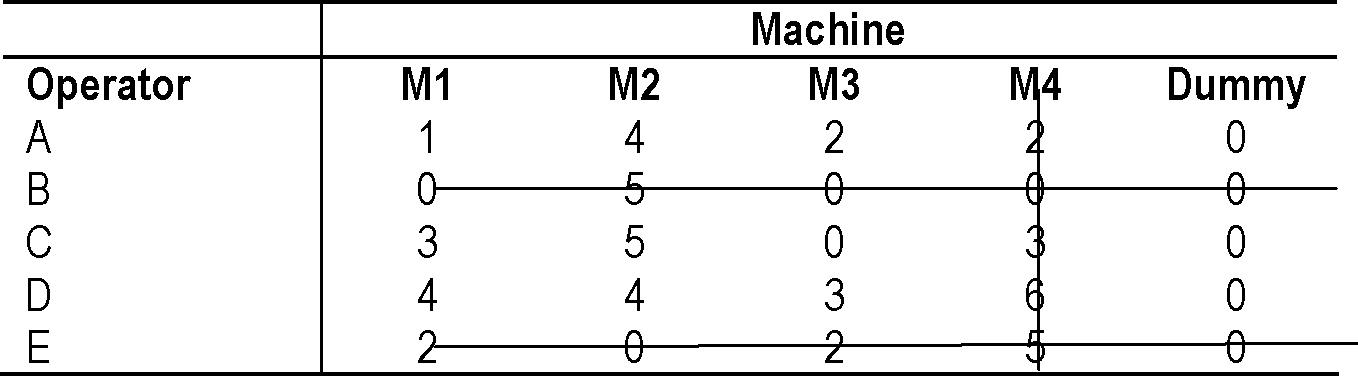
22. Output of 5 operators when they worked with different 4 machines are given in the table below:
|
Machine | ||||
|
Operator |
M1 |
M2 |
M3 |
M4 |
|
A |
10 |
5 |
7 |
8 |
|
B |
11 |
4 |
9 |
10 |
|
C |
8 |
4 |
9 |
7 |
|
D |
7 |
5 |
6 |
4 |
|
E |
8 |
9 |
7 |
5 |
|
Use assignment |
technique to solve it. | |||
|
23. Occurrence of rain in a city on a day is dependent up whether if rained on the previous day. | ||||||||||||||||||||||||||||||||
| ||||||||||||||||||||||||||||||||
Simulate the city's weather for 10 days and determine the rain fall during the period. Use the following random numbers: 67, 63, 39, 55, 29, 78, 70, 06, 78, and 76.
Time Series data Analysis
24. Explain the meaning of deseasonalisation of data. What Purpose does it serve ? Deseasonalise the following sales data with the help of seasonal index given below :
|
Month |
Sales Rs lakhs) |
Seasonal i |
|
January |
360 |
120 |
|
February |
400 |
80 |
|
March |
550 |
110 |
|
April |
360 |
90 |
|
May |
350 |
70 |
|
June |
550 |
100 |
Testing of Hypothesis
25. Quick Courier guarantees 90% of timely delivery of letters. In the recent week, out of 81 deliveries , 6 were late. Determine whether the claim of the courier company is legitimate at 95% confidence level.
SUGGESTED ANSWERS / HINTS
1. Revised Fixed Overhead rate :
Fixed Overheads = Rs (60,00,000 - 4,00,00 + 20,00,000) = Rs 76,00,000 Total Hours ( 3,00,000- 20,000 + 120,000) 4,00,000
Fixed Overhead rate per hour Rs 19.00
(i) Statement of Profit based on historical cost ( for 20,000 units of P)
|
Item |
Unit |
Rate (Rs) |
Rs Lakhs |
|
Material X |
60,000 kg |
80 |
48.00 |
|
Material Y |
40,000 ltrs |
300 |
120.00 |
|
Skilled Labour |
40,000 hrs |
150 |
60.00 |
|
Unskilled Labour |
80,000 hrs |
100 |
80.00 |
|
Variable Cost |
120,000 hrs |
30 |
36.00 |
|
Fixed Overhead |
120,000 hrs |
19 |
22.80 |
|
Total Cost |
366.80 | ||
|
Sales value of product P |
20,000 |
1800 |
360.00 |
|
Loss |
6.80 | ||
|
Statement of Profitability based on Relevance Cost | |||
|
Loss of profit from Sale of 5000 units of Product R : | |||
|
Rs lakhs | |||
|
Sales Value @ Rs 1000 |
50.00 | ||
|
Material Cost |
10.00 | ||
|
Wages of 20000 hours unskilled workers @ Rs 100 |
20.00 | ||
|
Variable Overhead of 20000 hours @ Rs 30 |
6.00 | ||
|
Fixed Overheads of 20000 hours @ Rs 20 |
4.00 | ||
|
Total Cost |
40.00 | ||
|
Profit |
10.00 | ||
|
Remarks Item Material X Material Y Skilled Labour Replacement cost Resale value Sunk cost |
(Rs) Lakhs 60.000 kg 100 60.00 40.000 ltrs 250 100.00 |
Unskilled Labour Variable Cost Fixed Overhead
Loss of Profit from sale of R Total Cost
80,000 hrs 100 120,000 hrs 30
80.00
36.00
20.00
10.00
306.00
360.00 54.00
Total
Identified portion - other not relevant
Opportunity Cost
Sales value of product P Profit
20,000 1800
2. (a)
|
2685000 2000000 685000 |
(b) Profitability to be maintained after process modification & capacity enhancement
|
Units to be produced Sales Value Substitute Material required ( kg) Total Variable cost per unit (excluding import material) Total Variable cost ( excluding cost of subs material) Contribution required + Sub Material Cost Profit required at enhanced rate Fixed Cost ( including interest on invest.) Contribution Required Substitute Material Cost of 6000 kg Cost Per kg of Substitute Material Transport Cost per kg Price may be offered per kg for substitute material |
|
Total
12180000
6000
5958000
6222000
890500
2375000
3265500
2956500
2.75
490
|
Cost of |
Cost of | |
|
Gadget |
component | |
|
Rs lakhs |
Rs Lakhs | |
|
Direct Material |
72.00 |
8.00 |
|
Direct Labour |
13.50 |
4.50 |
|
Indirect Labour |
7.00 |
3.00 |
|
Inspection & Testing |
4.80 |
1.20 |
|
Power |
2.70 |
0.30 |
|
Total Variable Cost |
100.00 |
17.00 |
|
Units Manufactured |
5000 |
17000 |
|
Cost Per Unit ( Rs) |
2000.00 |
100.00 |
|
Contribution per unit ( Rs) |
500.00 |
20.00 |
Note : Insurance and lighting cost is fixed in nature. Variable cost of manufacturing of component is less than market price. Hence, decision is to make.
3. (a)
(b) If the order of 1000 additional units is accepted,
Contribution from the offer ( 500 x 1000) = Rs 5 lakhs
Loss of Contribution of 17000 components @ Rs. 20 = Rs 3.40 lakhs Net Gain in Contribution = Rs 1.60 lakhs.
Hence the offer should be accepted.
4. (a) If Plant is in Operation
Contribution per unit = Rs 100 Total Contribution from 2000 units Fixed Cost for the Quarter ( 14 x 0.25)
= Rs 2.00 lakhs. = Rs 3.50 lakhs = Rs 1.50 lakhs
= Rs 1.00 lakhs = Rs 0.40 lakhs = Rs 1.40
Expected Loss in operation If Plant is Shut Down Unavoidable fixed cost for the period Shutdown cost Total Loss on Shut Down Hence, plant may be shut down.
(b) Shut Down point = ( Fixed Cost - Shutdown cost) / Contribution per unit
= ( 3,50,000 - 1,40,000 ) / 100 = 2,100 units
(c) Other non-cost factors to be considered for shut-down :
(i) Difficulty in getting the skilled workers at the time of re-opening, because worker might switch over to other jobs.
(ii) Re-opening cost of plants
(iii) Effect on long shutdown on the machinery
(iv) Loss of loyalty to customers etc
5. (a) On Discontinuance of D, sale of C will be 75% and henceProfitability of C will be
affected as follows :
For Product C Rs Lakhs
Sale 180.00
Direct Material 51.00
Direct Wages 48.00
V Factory Overheads 20.25 Fixed Factory Overads 27.00
V Selling & Dist Overheads 9.00 Fixed Selling & Dist Overheads 8.00
| ||||||||||||||||||||||||||||||||||||||||||||||||||||||||||||||||
|
Profit 326 | ||||||||||||||||||||||||||||||||||||||||||||||||||||||||||||||||
Total Profit including that of C = Rs 335.25 lakhs i.e increase by Rs 32.25 lakhs. Variable Cost per unit of X
6.
|
Item |
Dept A ( Rs) |
Dept B ( Rs) |
Total (Rs) |
|
Direct Material |
240 |
200 |
440 |
|
Direct Labour |
240 |
300 |
540 |
|
Variable Overhead |
100 |
90 |
190 |
|
Variable S/D Overheads |
150 | ||
|
Total Variable Cost |
1320 | ||
|
Fixed Cost = Rs 8000 ( 60 x 2 + 40 x 3) = Rs 19. 20 lakhs | |||
|
Fixed Capital Employed = |
Rs ( 40+28+25+7) lakhs |
= 100 lakhs | |
|
Return Expected @ 24 % on capital = 24 lakhs | |||
(a) For New Product, minimum price may be at variable cost i.e Rs 1320.
(b) When the product will be established one, unit sold will be 6400 units.
Fixed Cost + Return on Capital per unit = Rs (24 + 19.2) lakhs/ 6400 = Rs 675. It is assumed that S/D cost will be at the same rate.
Price to be charged = Rs ( 1320 + 675) = Rs 1995.
7. (a) Total patient-days = 165 x30 + 100 x 25 + 100 x 20 = 9450
Total Cost = Rs ( 11.34 + 17.66) = Rs 29.00 lakhs Total Revenue required = Rs 29.00 x 1.30 lakhs = 37.70 lakhs Charge for patient-day = Rs 37,70,000 / 9450 = Rs 400 approx Variable Cost per patient-day = Rs 11,34,000 / 9450 = Rs 120 Contribution per patient-day = Rs 280
BEP Patient- days = 1766,000/ 280 = 6307 i.e 17.28 per day average
(b) Average 50% occupancy = patient-days = 365 x 15 =5475 Contribution required per day = 1766,000 / 5475 = Rs 322.55 Charge per Patient-day = Rs ( 120 + 322.55) = Rs 442.55 = Rs 445 ( rounded)
8.
| ||||||||||||||||||||||||
|
When sold in outside market Transfer to Div B |
|
Product |
Units |
Lobour |
Contribution |
Units |
Lobour |
Contribution |
|
Hours |
( Rs) |
Hours |
(Rs) | |||
|
Z |
300 |
900 |
27000 |
300 |
900 |
27000 |
|
Y |
500 |
2000 |
50000 |
800 |
3200 |
74000 |
|
X |
500 |
1500 |
30000 |
100 |
300 |
6000 |
|
Total |
4400 |
107000 |
4400 |
107000 |
On 300 units transfer of Y, loss on production of X by 400 units will cause loss of contribution of Rs 24,000. Thus, 300 units transfer should make up loss @ Rs 80 per unit. Thus, transfer price of Rs 430 satisfies the same.
(ii) If only 5900 hours available, production of Division A will be :
When sold in outside market Transfer to Div B
Product Units Lobour Contribution Units Lobour Contribution Hours (Rs) Hours required
(Rs)
Z 300 900 27000 300 900 27000
Y
X
Total
500
800
2000
2400
5300
50000
48000
125000
800
600
3200
1800
5900
62000
36000
125000
In this case, on 300 units transfer of Y, loss on production of X by 200 units will cause loss of contribution of Rs 12,000. Thus, 300 units transfer should make up loss @ Rs 40 per unit.
In this case, transfer price may be fixed at Rs 390.
Division A will earn higher contribution of Rs 18,000 for its extra effort.
And a transfer price of Rs 430 will give Division A Rs 30,000 higher contribution. Total Machine hour = 1500+250+600+4000 = 6350 hrs
9.
Overheads rate per machine hr = Rs ( 1,27,000+ 9000+ 10400+6000 ) / 6350 = Rs 24 No of Set up = 18, Cost per set up = Rs 9000 / 18 = Rs 500 No of Purchase Orders = 13, Cost per Purchase Order = Rs 10,400 / 13 = Rs 800 No Of Material Handling = 30, Cost per material handling = Rs 6000 / 30 = 200 Other Factory Overheads rate on basis of Machine hr = Rs 1,27,000 /6350 = Rs 20 Cost of Products in present system per unit in Rupees
|
Products --- |
W |
X |
Z | ||
|
Material Cost ( Rs) |
50 |
70 160 |
180 | ||
|
Labour Cost ( Rs) |
50 |
0 0 0 6 |
75 | ||
|
Overheads at M/C hr rate |
12 |
12 48 |
96 | ||
|
Total Cost |
112 |
8 0 3 2 4 |
351 | ||
|
Cost of Products on the basis of Activity Based Costing per unit in rupees : | |||||
|
Products --- |
W |
X |
Y |
Z | |
|
Material Cost |
50.00 |
70.00 |
160.00 |
180.00 | |
|
Labour Cost |
50.00 |
60.00 |
100.00 |
75.00 | |
|
Set Up Cost |
5000/3000=1.67 |
500/500= 1 |
500/600=0.83 |
5000/1000=5.00 | |
|
Ordering Cost |
4800/3000=1.60 |
800/500=1.60 |
800/600=1.33 |
4000/1000=4.00 | |
|
Material Handling |
2400/3000= 0.80 |
200/500= 0.40 |
200/600=0.33 |
3000/1000=3.00 | |
|
Other Factory OH |
10.00 |
10.00 |
40.00 |
80.00 | |
|
Total Cost |
114.07 |
133.00 |
302.49 |
347.00 | |
|
(a) Material Procurement Budget |
Rupees in lakhs | ||||
|
Dec |
b e F n a |
March April | |||
|
(a) Sales |
30 |
32 28.0 |
30.0 32 | ||
|
(b) Profit |
7.5 |
.0 7. 8 |
7.5 8. | ||
|
(c) Cost of Sales |
22.5 |
24 |
21.0 |
22.5 |
24 |
|
(d) Wages & other overheads |
9.0 |
9.0 |
9.0 |
9.0 |
9.0 |
|
(e) Depreciation ( 4 / 4 ) |
1.0 |
1.0 |
1.0 |
1.0 |
1.0 |
|
(f) Material requirement (c - d |
- e) 12.5 |
14.0 |
11.0 |
12.5 |
14 |
|
(g) Opening Balance |
3.75 |
4.2 |
3.3 |
3.75 |
4.2 |
|
(h) Closing Balance |
4.2 |
3.3 |
3.75 |
4.2 | |
|
(i) Material to be procured |
12.95 |
13.5 |
11.45 |
12.95 | |
|
Cash Budget |
Rupees in lakhs | ||||
|
Jan |
Feb |
March | |||
|
Opening Balance |
8.0 |
12.05 |
18.55 | ||
|
Receipts from cash Sale |
7.0 |
8.0 |
8.0 | ||
|
Receipts from Credit Sale |
23.0 |
25.0 |
20.0 | ||
|
Total |
38.0 |
45.05 |
46.55 | ||
|
Interest Payment |
4.0 |
4.0 |
4.0 | ||
|
Payment for Material |
12.95 |
13.5 |
11.45 | ||
|
Wages & Rent |
7.0 |
7.0 |
7.0 | ||
|
Admin Expenses |
2.0 |
2.0 |
2.0 | ||
|
Total |
25.95 |
26.5 |
24.45 | ||
|
Closing Balance |
12.05 |
18.55 |
22.10 | ||
|
11. Budget for the next year based on optimistic assumptions ( Figures in Rs Lakhs) | |||||||||||||||||||||||||||||||||||||||||||||||||||||||
| |||||||||||||||||||||||||||||||||||||||||||||||||||||||
12. Next year Order Size = 20,000 x 0.35 + 25,000 x 0.50 + 30,000 x 0.15 = 25,000 Increase in volume by 25%
Metal price will increase by 5% and fixed expenses by 15%
|
20,000 units Cost Per Unit ( Rs) |
25,000 units | |
|
Direct material |
100.00 |
95.00 |
|
Direct Wages |
40.00 |
42.00 |
|
Direct Expenses |
10.00 |
10.00 |
|
Variable cost per unit |
150.00 |
147.00 |
|
Total Variable Cost ( Rs Lakhs) |
30.00 |
36.75 |
|
Overheads |
Rs Lakhs |
Rs Lakhs |
|
Indirect Material |
2.60 |
3.35 |
|
Indirect Wages |
1.50 |
2.10 |
|
Indirect Expenses |
0.50 |
0.55 |
|
Selling Expenses |
4.00 |
5.25 |
|
Fixed Overheads |
5.50 |
6.235 |
|
Total Overheads |
13.50 |
17.485 |
|
Total Cost ( Rs lakhs) |
43.50 |
54.235 |
|
Sales Value |
50.00 |
62.50 |
|
Profit |
6.50 |
8.265 |
Increase in profit will by 1.765 i.e 27.2 % approx.
13. (a) Material Price Variance = AQ x ( SR- AR) = 2520 ( 40 - 42) = Rs 5040 (A)
Material Usage Variance = SR x ( SQ - AQ) = 160 ( 2400 - 2380) = 3200(F)
Labour Rate Variance = AH ( SR - AR) = 580 ( 100- 98) = 1160 (F)
Labour Efficiency Variance = SR x ( SH - AH ) = 100 ( 600- 580) = 2000 (F)
Labour Idle Time Vriance = SR x Idle Time = 100 ( 580-550) = 3000 ( A)
Variable Overhead Exp Var = ( BVOH - AVOH) = 550 x 30 - 19,200 = Rs 2,700 (A) Variable Overhead Efficiency Var= SR ( SH - AH) = 30 ( 585 - 590) = 150 ( A)
Fixed Overhead Expenditure Var= ( BFOH - AFOH) = 600 x 50 - 31,500= Rs 1,500(A) Fixed Overhead Volume Var= BFOH per unit( BV - AV) = 50 ( 600 - 585) = 750 ( A) Fixed Overhead Efficiency Var = BFOH per hr ( SH - AH) = 50( 585- 550) = Rs 1750(F) Fixed Overhead Capacity Var= BFOH per hour ( Bugt Capacity - Actual capacity )
= 50 ( 600- 550) = 2500 ( A)
Sales Price Variance = AQ ( SP - AP) = 585 ( 400 - 390) = Rs 5850 ( A)
Sales Volume Variance = Std Profit per unit ( Budgeted sales unit - Actual Sales Unit) = 60 ( 600 - 585) = 900 ( A)
(b) Operating Statement for the month of January, 2010
Budgeted Profit ( before Selling & Administrative Exp) ( 600 x 6)
Rs 36,000 5,400 Rs 30,600
Selling & Administrative Expenses Profit
Sales Variances :
Price 5850 (A)
Volume 900 ( A)
6,750(A)
23,850
Actual Sales minus Standard Cost of Sales
F
3200
1160
2000
A
5040
3000
2700
150
1,500
750
2500
15640
1750
8110
7, 530(A) 16, 320
Cost Variances :
Material Price Variance Material Usage Variance Labour Rate Variance Labour Efficiency Variance Labour Idle Time Variance Variable Overhead Expenditure Var Variable Overhead Efficiency Var Fixed Overhead Expenditure Var Fixed Overhead Volume Var Fixed Overhead Efficiency Var Fixed Overhead Capacity Var
Actual Profit for the month
14. It is assumed that Fixed Overheads have been assessed at normal production. Moreover, the sales commission is not involved in the case of special order.
Taking Variable Factory Overheads @ 20% of wages,
Total cost of the special order will be Rs ( 1.00 + 0.60 + 0.12) laks i.e Rs 1.72 lakhs Thus, the special order, if executed will give profit of Rs 28,000.
Hence, the order should be accepted.
|
B Total 4300 600 1800 3600 1500 units 18,00,000/3600= 500 sets 64.5 100.50 2400 5100 1412 18,00,000/5100 =353 33.888 62.481 |
As BEP in Option 2 is at lower sales, it is preferable.
16. Average cost for first 200 units = 0.90 x 200 = Rs 180 Average cost for first 400 units = 0.90 x 180 = Rs 162 Average cost for first 800 units = 0.90 x 162 = Rs 145.80 Average cost for first 1600 units = 0.90 x 145.80 = Rs 131.22 We know that learning curve equation :
Y= ax Ab
Where y = average time for producing x units a = time spent on first unit / batch b= co-efficient of learning curve
b= - log ( 1 - % decrease) / Log 2 = log ( 1 - 0.10) / log 2 = - 0.0458/0.3010 =- 0.15206
Thus, for 2000 units, batch = 2000/ 100 = 20 Y= 200 x 20 a-0.15206
Log y= log (200) - 0.15206( log 20) = 2.3010 - 0.15206 x 1.3010 = 2.103172
Thus y = antilog (2.103172) = 126.81
Thus, average labour cost for 2000 units = Rs 126.81
Thus, price to be quoted for different units are :
|
First 800 |
First 1600 |
First 2000 | |
|
units |
units ( Rs) |
units ( Rs) | |
|
(Rs) | |||
|
Material @ Rs 150 |
120000 |
240000 |
300000 |
|
Labour Cost |
116640 |
209952 |
253620 |
|
Overheads |
40000 |
80000 |
100000 |
|
Total Cost |
276640 |
529952 |
653620 |
|
Profit |
69160 |
132488 |
163405 |
|
Price to be quoted |
345800 |
662440 |
817025 |
17. (a) Life cycle costing as its name implies costs the cost object i.e., product, project etc. over its projected life. It is used to describe a system that tracks and accumulates the actual costs and revenues attributable to cost object from its inception to its abandonment. The profitability of any given cost object can therefore be determined at the end of its economic life.
Life cycle costing is different to traditional cost accounting system which report cost object profitability on a calendar basis i.e. monthly, quarterly and annually. In contrast life cycle costing involves tracing cost and revenues on a product by product bases over several calendar periods. Costs and revenue can be analysed by time period, but the emphasis is on cost revenue accumutation over the entire life cycle of each product.
The benefits of product life cycle costing are summarized as follows :
(i) The product life cycle costing results in earlier actions to generate revenue or to lower costs than otherwise might be considered. There are a number of factors that need to the managed in order to maximise return on a product.
(ii) Better decisions should follow from a more accurate and realistic assessment of revenues and costs, at least within a particular life cycle stage.
(iii) Product life cycle thinking can promote long-term rewarding in contrast to short-term profitability rewarding.
(iv) It provides an overall framework for considering total incremental costs over the entire life span of a product, which in turn facilitates analysis of parts of the whole where cost effectiveness might be improved.
(b) The theory of constraints focuses its attention on constraints and bottlenecks within organisation which hinder speedy production. The main concept is to maximize the rate of manufacturing output is the throughput of the organisation. This requires to examine the bottlenecks and constraints. A bottleneck is an activity within the organization where the demand for that resource is more than its capacity to supply.
A constraint is a situational factor which makes the achievement of objectives / throughput more difficult than it would otherwise, for example of constraint may be lack of skilled labour, lack of customer orders, or the need to achieve high quality in product output.
For example let meeting the customers' delivery schedule be a major constraint in an organisation. The bottleneck may be a certain machine in the factory. Thus bottlenecks and constraints are closely examined to increase throughput.
Key measures of theory of constraints:
(i) Throughput contribution: It is the rate at which the system generates profits through sales. It is defined as, sales less completely variable cost, sales -direct are excluded. Labour costs tend to be partially fixed and conferred are excluded normally.
(ii) Investments: This is the sum of material costs of direct materials, inventory, WIP, finished goods inventory, R & D costs and costs of equipment and buildings.
(iii) Other operating costs: This equals all operating costs (other than direct materials) incurred to earn throughput contribution. Other operating costs include salaries and wages, rent, utilities and depreciation.
18. (a) Value chain may be defined as a series of internal processes or activities a company performs, " to design, produce, market,deliver and support its product. " A firms value chain and the way it performs individual activities are a reflection of its history, its strategy, its approach of implementing strategy , and the underlying economics of the activities themselves. For further details refer to Chapter 13 of Cost Management Book of the Institute
(b) In order to gain a competitive advantage over its competitors , a company needs to profitably satisfy or even exceed the needs and expectations of its various customers. This can be done by the use of Value Chain Analysis . This analysis can be used to better understand which segments, distribution channels, price points, product differentiation , selling propositions and value chain configurations will yield the firm its greatest competitive advantage. The use of VCA to assess competitive advantage involves the following analysis:
(i) Internal Cost Analysis : Organisations use the value chain approach to identify sources of profitability and to understand the cost of their internal processes or activities. The principal steps of internal cost analysis are :
1. Identify the firm's value-creating processes.
2. Determine the portion of the total cost of the product or services attributable to each value-creating process.
3. Identify the cost drivers for each process.
4. Identify the links between processes.
5. Evaluate the opportunities for achieving relative cost advantage.
(ii) Internal Differentiation Analysis : The value chain approach is also used by organisations to identify opportunities for creating and sustaining superior differentiation. In this situation, the primary focus is on the customer's perceived value of the products and services.
As with internal cost analysis, internal differentiation analysis requires firms to first identify their value-creating processes and primary cost drivers. They are then ready to perform a differentiation analysis using the following guidelines :
1. Identify the customers' value-crating processes;
2. Evaluate differentiation strategies for enhancing customer value; and
3. Determine the best sustainable differentiation strategies.
(iii) Vertical Linkage Analysis : Linkages among value-creating processes do not end with the activities within a firm. The greatest competitive advantage may come out of linkages between a firm's value-creating activities and those of its suppliers, channels or users.
Vertical linkage analysis is a much broader application of internal cost and differentiation analysis that includes all upstream and downstream value-creating processes throughout the industry. Vertical linkage analysis considers all links from the source of raw materials to the disposal and/or recycling of the product.
19. Let x1, x2, x3 are number of units of products P, Q, R respectively. Mathematical formulation for the problem with three stock variables s1, s2 and s3 :
Maximize Z = 3x1 + 2x2 + 5x3 + 0s1 + 0s2 + 0s3
Subject to constraints:
x1 + 2x2 + 2x3 + s1 = 8
3x1 + 2x2 + 6x3 + s2 = 12
2x1 + 3x2 + 4x3 + s3 = 12
x1, x2, x3, s1, s2, s3 S 0
We shall now the solve the problem with simples algorithm. An initial Basic feasible solution is:
x1 = 0, x2 = 0, x3 = 0, s1 = 8, s2 = 12 = s3 = 12.
SIMPLEX TABLEAU 1, II, & III
|
Cj |
Basic |
Solution |
3 |
2 |
5 |
0 |
0 |
0 |
Ratio |
|
CBj |
variables |
values |
x1 |
x2 |
x3 |
s1 |
s2 |
S3 | |
|
0 |
s1 |
8 |
1 |
2 |
2 |
1 |
0 |
0 |
4 |
|
0 |
s2 |
12 |
3 |
2 |
6* |
0 |
1 |
0 |
2 |
|
0 |
s3 |
12 |
2 |
3 |
4 |
0 |
0 |
1 |
3 |
|
s2 leaves Cj - Zj 3 2 5| 0 0 0 | ||||||||||||||||||||||||||||||||||||||||||||||||||||||||||||||||||||||||||||||||||||||||||||||||||||
|
Since all the entries in Cj - Zj row are either negative or zero, an optimum solution has been obtained and the maximum value of Z is 12 which occurs when x1 = 4, x2 = 0 and x3 = 0.
Since x2 is a non-basic variable and the corresponding Cj - Zj entry in the final simplex tableau is 0, the optimum solution obtained is not unique. To obtain an alternate optimum solution, we perform one more iteration. Taking x2 as an entering variable, we obtain the following tableau:
| ||||||||||||||||||||||||||||||||||||||||||||||||||||||||||||||||||||||||
|
as before. It may be noted that the entries under the columns s1, s2, s3 in the Cj - Zj row of the final tableau are 0, -1, 0. Their absolute values, viz., 0, 1, 0 are known as the shadow prices of the resources. Hence the shadow prices of the resources are 0, 1 and 0 respectively. | ||||||||||||||||||||||||||||||||||||||||||||||||||||||||||||||||||||||||
A
3
B
5
C
5
D
4
E
2
F
3
Expected duration = (tc + 4tm + tp) 6
|
Project cost = Normal cost + Penalty Cost = Rs.62,000 + (13 - 10) x 2,500 = Rs.69,500 | ||||||||||||||||||||||||||||||||||||||||||
| ||||||||||||||||||||||||||||||||||||||||||
|
Crash the critical activities where cost shape is less than 2,500/Activities No. of days crashed Cost shape Crash cost (Rs.) |
2,000
A
E
2,000
1.500
3.500
1,500
Total Crash Cost (Rs.)
Project duration = 11 weeks Total Project cost
= Normal Cost + Crash Cost + Penalty Cost = Rs.(62,000 + 3,500 + 2,500) = Rs.68,000
|
21. Following Vogel's Approximation Method (VAM), an initial feasible solution is: | ||||||||||||||||||||||||||||||||||||||||||||||||||||||||||||||||||||||||||||||||
| ||||||||||||||||||||||||||||||||||||||||||||||||||||||||||||||||||||||||||||||||
|
Since, there are 6 allocation i.e. (4 + 3 - 1) and all the opportunity cost are negative, the optimum solution has been reached. | ||||||||||||||||||||||||||||||||||||||||||||||||||||||||||||||||||||||||||||||||
Transportation Cost
= Rs.(10,000 x 50 + 18,000 x 40 + 6,000 x 70 + 14,000 x50 + 16,000 x 30)
= Rs.3,32,000
22. Step 1: The problem is a maximization one. Convert it to minimization one as the assignment algorithm is for minimization. All elements are subtracted from the largest element 11.
As there are 5 operators and only 4 machines, one dummy machine with no output is introduced.
Cut all zero with minimum number of straight lines. No of Lines = 4 < No of machines
| ||||||||||||||||||||||||||||||||||||||||||
|
Step 2: Subtract minimum elements of a column from other elements of the respective column. | ||||||||||||||||||||||||||||||||||||||||||
|
Step 4: Add minimum element not crossed i.e. 1 to the doubly crossed element and subtract all other elements by 1. Cut all Zeros by drawing lines. |
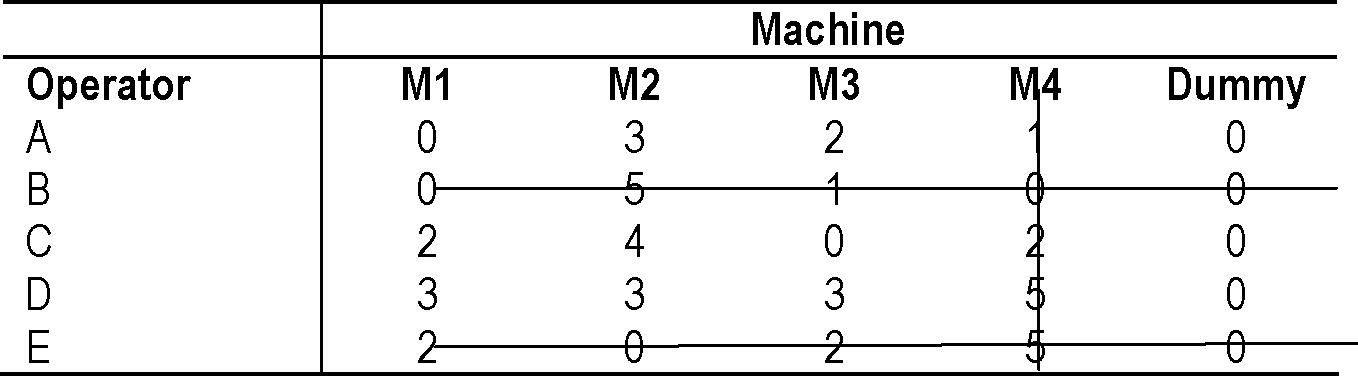 |
Step 5: Now, Number of lines drawn to cut zero = 5 = No of machines Hence the solution is an optimum one.
Now, Assignment. Is as follows :
Operator Machine Output
A M1 10
B M4 10
C M3 9
D Dummy 0
E M2 _9
Total Output 38 units.
|
23. Assume that one the 1st day of simulation, there was no rain on the previous day. Table 1 Rain on previous day. | ||||||||||||||||||||||||||||
| ||||||||||||||||||||||||||||
|
Table 2: No rain previous day |
| ||||||||||||||||||||
|
Table 3: Simulation Sheet |
| |||||||||||||||||||||||||||||||||||||||||||||||||||||||
|
24. Deseasonalisation means elimination of seasonal effect on the original data so that they can be analysed more rationally. Deseasonalization is done with the help of two models : Additive Model : Yd = Y - S Multiplicative Model : Yd = (Y / S ) x 100 Where Yd = deseasonalsed data & S = Seasonal index |
|
Month |
Sales |
Seasonal index |
Deseasonalised value |
|
(Rs lakhs) |
Yd = (Y /S) X 100 | ||
|
January |
360 |
120 |
(360/120) x 100 = 300 |
|
February |
400 |
80 |
(400/80) x 100 = 500 |
|
March |
550 |
110 |
(550 /110)x 100 = 500 |
|
April |
360 |
90 |
(360/90) x 100 = 400 |
|
May |
350 |
70 |
(350/70) x 100 = 500 |
|
June |
550 |
100 |
(550/100))x 100 = 550 |
25. Let Ho = No difference between population and sample proportion
For delay in delivery, Sample proportion p = 6/81 = 0.074, Population proportion = 0.10 Z = ( 0.074- 0.10 ) / SE of p = - 0.026 / V(0.1 x0.9)/81 - (0.026 x 3) / 0.1 = - 0.078
Critical value of Z at 95% level of confidence = 1.96 As I Z I < 1.96, Ho is accepted.
30
|
Attachment: |
| Earning: Approval pending. |