The Institute of Chartered Financial Analysts of India University 2010 C.A Chartered Accountant Integrated Professional Competence (IPCC) Revision Test s- 3 (I)-Cost Accounting - Question Paper
May 2010: The Institute of Chartered Accountants of India - Revision Test ques. papers (RTPs) Integrated Professional Competence Course (IPCC) Examination: Paper three (I) Cost Accounting: May 2010 University ques. paper
PAPER - 3 : COST ACCOUNTING AND FINANCIAL MANAGEMENT PART - I : COST ACCOUNTING QUESTIONS
1. (i) A company produces the product ABC which sells for Rs. 25 per unit. Variable cost is Rs. 20 per unit and Fixed overhead for the year is Rs. 6,00,000.
Required:
(a) Calculate sales value needed to earn a profit of 10% on sales.
(b) Calculate margin of safety sales if profit is Rs. 1,20,000.
(ii) Calculate Efficiency and Capacity ratio from the following figures:
Budgeted production 160 units
Actual production 120 units
Standard time per unit 8 hours
Actual hours worked 1000
(iii) Calculate total passenger kilometres from the following information:
Number of buses 12, number of days operating in a month 25, trips made by each bus per day 10, distance covered 20 kilometres (one side), capacity of bus 40 passengers, normally 90% of capacity utilization.
(iv) A machinery was purchased from a manufacturer who claimed that his machine could produce 39.5 tonnes in a year consisting of 365 days. Holidays, break-down, etc., were normally allowed in the factory for 70 days. Sales were expected to be 28 tonnes during the year and the plant actually produced 28.2 tonnes during the year. You are required to state the following figures:
(a) rated capacity
(b) Normal capacity
(v) Using Taylor's differential piece rate system, find the earning of X from the following particulars:
Standard time per piece 10 minutes
Normal rate per hour (in a 8 hours day) Rs. 24
X produced 45 Units
Basic Concepts
2. (i) Describe briefly the role of the cost accountant in a manufacturing organisation.
(ii) Distinguish between:
(a) Variable cost and direct cost
(b) Estimated cost and standard cost.
3. The following details apply to an annual budget for a manufacturing company:
|
Quarter |
1st |
2nd |
3rd |
4th |
|
Working days |
65 |
60 |
55 |
60 |
|
Production (units per working day) |
100 |
110 |
120 |
105 |
|
Raw material purchases (%by weight of annual total) |
30% |
50% |
20% | |
|
Budgeted purchases price (per kg.) Quantity of raw materials per unit of production |
Re. 1 : 2 kg. |
Rs. 1.05 |
Rs. 1.125 |
Budgeted opening stock of raw materials 4,000 kg. (cost Rs. 4,000)
Budgeted closing stock of raw materials 2,000 kg.
Issues are priced on FIFO basis.
Calculate the following budget figures:
(a) Quarterly and annual purchases of raw material, by weight and value.
(b) Closing quarterly stock by weight and value.
4. Calculate the earnings of A and B from the following particulars for a month and allocate the labour cost to each job X, Y and Z:
|
A |
B | ||
|
(i) |
Basic Wages |
Rs. 100 |
160 |
|
(ii) |
Dearness Allowance |
50% |
50% |
|
(iii) |
Contribution to Provident Fund (on basic wages) |
8% |
8% |
|
(iv) |
Contribution to Employees' State Insurance (on basic wages) |
2% |
2% |
|
(v) |
Overtime Hours |
10 |
The Normal working hours for the month are 200. Overtime is paid at double the total of normal wages and dearness allowance. Employer's contribution to State Insurance and Provident Fund are at equal rates and employees' contributions. The two workers were employed on jobs X, Y and Z in the following proportions:
| ||||||||||||||||
|
Overtime was done on job Y. |
Overheads
5. Yapp Ltd, an engineering company, having 25 different types of automatic machines, furnishes you the following data for 2008-09 in respect of Machine B:
Rs.
1. Cost of machine 50,000 Life 10 years with no scrap value.
2. Overhead expenses are:
Factory rent 50,000 p. a.
Heating and lighting 40,000 p. a.
Supervision 1,50,000 p.a.
Reserve equipment for Machine B 5,000 p. a.
Area of the factory 80,000 sq. m.
Area occupied by Machine B 3,000 sq. m.
Power cost 50 paise per hour while in operation.
3. Wages of operator is Rs. 24 per days of 8 hours including all fringe benefits. He attends to one machine when it is under set up and two machines while under operation.
4. Estimated production hours 3,600 p.a.
Estimated set up time in hours 400 p.a.
Prepare a schedule of comprehensive machine hour rate and find the overhead chargeable to the following jobs:
Job 1203 Job 1502
Set up time (hours) 80 40
Operation time (hours) 130 160
Non-Integrated Accounting
6. The financial records of Anamika Manufacturers Ltd. reveal the following for the year ended 30-6-2009:
Rs. in thousands
Sales (20,000 units) 4,000
Materials 1,600
Wages 800
Factory Overheads 720
Office and Administrative Overheads 416
Selling and Distribution Overheads 288
Finished Goods (1,230 units) 240 Work-in-progress:
Labour 32
Overheads (Factory) 32 112
Goodwill written off 320
Interest on Capital 32
In the Costing records, factory overhead is charged at 100% of wages, administration overhead 10% of factory cost and selling and distribution overhead at the rate of Rs. 16 per unit sold.
Prepare a statement reconciling the profit as per cost records with the profit as per financial records of the company.
Contract Costing
7. Sheron Limited undertook a contract for Rs.5,00,000 on 1st July, 2008. On 30th June, 2009 when the accounts were closed, the following details about the contract were gathered:
Rs.
Materials Purchased 1,00,000
Wages Paid 45,000
General Expenses 10,000
Plant Purchased 50,000
Materials on Hand 30.06.09 25,000
Wages Accrued 30.06.09 5,000
Work Certified 2,00,000
Cash Received 1,50,000
Work Uncertified 15,000
Depreciation of Plant 5,000
The above contract contained an escalator clause which read as follows:
"In the event of prices of materials and rates of wages increase by more than 5% the contract price would be increased accordingly by 25% of the rise in the cost of materials and wages beyond 5% in each case."
It was found that since the date of signing the agreement the prices of materials and wage rates increased by 25%. The value of the work certified does not take into account the effect of the above clause.
Prepare the contract account. Workings should form part of the answer.
8. Mr. Robbin Sharma owns a bus which runs according to the following schedule:
(i) Delhi to Chandigarh and back, the same day.
Distance covered: 150 kms, one way Number of days run each month: 8 Seating capacity occupied 90%
(ii) Delhi to Agra and back, the same day.
Distance covered : 120 kms. One way Number of days run each month: 10 Seating capacity occupied 85%
(iii) Delhi to Jaipur and back, the same day Distance covered: 270 kms. one way.
Number of days run each month: 6 Seating capacity occupied 100%
(iv) Following are the other details:
Cost of the bus Salary of the driver Salary of the Conductor Salary of the part-time Accountant Insurance of the bus Diesel consumption 4 kms per litre Road tax Lubricant oil Permit fee
Rs. 6,00,000 Rs. 2,800 p.m. Rs. 2,200 p.m. Rs. 200 p.m. Rs. 4,800 p.a. Rs. 6 per litre Rs. 1,500 p.a. Rs. 10 per 100 kms. Rs. 315 p.m. Rs. 1,000 p.m. @ 20% p.a. 50 persons.
Repairs and maintenance Depreciation of the bus Seating capacity of the bus
Passenger tax is 20% of the total takings. Calculate the bus fare to be charged from each passenger to earn a profit of 30% on total takings. The fares are to be indicated per passenger for the journeys:
(i) Delhi to Chandigarh
(ii) Delhi to Agra
(iii) Delhi to Jaipur
9. A certain product passes through two processes before it is completed and transferred to finished stock. The following data relate to January, 2010:
|
Process I |
Process II |
Finished Stock | |
|
Rs. |
Rs. |
Rs. | |
|
Opening stock |
15,000 |
18,000 |
45,000 |
|
Direct materials |
30,000 |
31,500 | |
|
Direct wages |
22,400 |
22,500 | |
|
Factory overheads |
21,000 |
9,000 | |
|
Closing stock |
7,400 |
9,000 |
22,500 |
|
Inter-process profit included in opening stock |
3,000 |
16,500 |
Output of Process I is transferred to Process II at 25% profit on the transfer price.
Output of Process II is transferred to finished stock at 20% profit on the transfer price.
Stocks in Process are valued at prime cost. Finished stock is valued at the price at which it is received from Process II. Sales during the period are Rs. 2,80,000.
Prepare and compute:
(a) Process cost accounts and finished goods account showing the profit element at each stage;
(b) Actual realized profit ; and
(c) Stock valuation for balance sheet purpose.
Standard Costing
10. The standard labour complement and the actual labour complement engaged in a week for a job are as follows:
| ||||||||||||||||||||||||||||||||
|
During the 40 hours working week the gang produced 1,800 standard labour hours of work. |
Calculate:
(i) Total labour cost variance;
(ii) Labour efficiency variance;
(iii) Labour mix variance ; and
(iv) Rate of wages variance.
Marginal Costing
11. (i) Explain and illustrate cash break-even chart.
(ii) Aiasha ltd. has furnished the following data for the two years:
2008 - 09 Rs. 8,00,000 50%
2009 - 10 ?
37.5%
40%
21.875%
Sales
P/V Ratio
Margin of Safety
(Sales as a % of Total sales)
There has been substantial savings in the fixed cost in the year 2009-10 due to the restructuring process. The company could maintain its sales quantity level of 200809 in 2009-10 by reducing selling price.
You are required to calculate the following:
i. Sales for 2009-10 in rupees
ii. Fixed cost for 2009-10
iii. Break even sales for 2009-10 in rupees Budgets and Budgetary Control
12. The budgeted cost of a factory specialising in the production of a single product at the optimum capacity of 6,400 units per annum amounts to Rs. 17,60,480 as detailed below:
Rs.
2,06,880
Fixed costs
Variable costs:
Power
14,400
17,000
5,400
4,92,800
Repairs, etc.
Other variable cost
Direct material
15,53,600
Direct labour
10,24,000
17,60,480
Considering the possible impact on sales turnover by market trends, the company decides to prepare flexible budget with a production target of 3,200 and 4,800 units. On behalf of the company you are required to prepare a flexible budget for production levels at 50% and 75%.
Assuming the selling price per unit is maintained at Rs. 400 as at present, indicate the effect on net profit. Administration, selling and distribution overheads continue at Rs.
36,000.
1. (i) (a) Suppose sales units are x then S=V+F+P S = Sales V = Variable Cost F = Fixed Cost P = Profit
25x = 20x + 6,00,000 + 2.5x 25x - 22.5x = 6,00,000
x = 6,00,000 = 2,40,000 units 2.5
Sales value = 2,40,000 x 25 = Rs. 60,00,000 Profit . 1,20,000
(b) MSSales =
P/V ratio P/V
C5
C 5
where P/V = -x100 Or x 100 = 20%.
x100 Or: S 25
. 1,20,000 x 100 = 6,00,000 20
rir Actual output in terms of standardhours .nn
(ii) Efficiency Ratio =---x 100
Actual hour worked
Or x 100 = 96%
1000
Actualhours worked .nn
Capacity Ratio =-x 100
Budgetedhours
Or 1000 x 100 = 78.12%
1280
(iii) Calculation of passenger kilometers:
12 x 25 x 10x 2 x 20 x 40 x 90% = 43,20,000 passenger kms.
(iv) (a) Rated capacity 39.5 tonnes
(Refers to the capacity of a machine or a plant as indicated by its manufacturer)
(b) Normal capacity 28 tonnes
(It is the capacity of a plant utilized based on sales expectancy)
(v) Standard output per day 810j = 48 units
Actual output = 45 units
45
Efficiency percentage x100 = 93.75%
Under this method lower rate is 83% of the normal piece rate and is applicable if efficiency of worker is below 100%.
24
Earning rate per unit = 83% of or 3.32 per unit
6*
Earning = 45 x 3.32 = Rs. 149.4
* In one hour, production will be =-60 minutes-= 6units
standard time per peice, i.e. 10 minutes
Basic Concepts
2. (i) Cost accountant in a manufacturing organisation plays several important roles. He establishes a Cost Accounting department in his concern. He ascertains the requirement of cost information which may be useful to organisational mangers at different levels of the hierarchy. He develops a manual, which specifies the functions to be performed by the Cost Accounting department. The manual also contains the format of various forms which would be utilised by the concern for procuring and providing information to the concerned officers. It also specifies the frequency at which the cost information would be supplied to a concerned executive.
Usually, the functions performed by a Cost Accounting department includes cost ascertainment, cost comparison, cost reduction, cost control and cost reporting.
Cost ascertainment, requires the classification of costs into direct and indirect. Further it requires classification of indirect costs (known as overheads) into three classes viz, factory overheads; administration overheads and selling and distribution overhead. Cost accountant suggests the basis which may be used by his subordinates for carrying out the necessary classifications as suggested above.
Cost comparison is the task carried out by Cost Accountant for controlling the cost of the products manufactured by the concern. Cost Accountant of the concern establishes standards for all the elements of cost and thus a standard cost of the finished product. The standard cost so determined may be compared with the actual cost to determine the variances. Cost Accountant ascertains the reasons for the occurrence of these variances for taking suitable action.
Cost analysis may also be made by Cost Accountant for taking decisions like make or by and for reviewing the current performance.
Cost Accountant also suggests suitable techniques for the purpose of cost reduction/cost control, after carrying out a cost benefit analysis.
Cost Accountant also plays a key role in the preparation of Cost reports. These reports help the executives of a business concern in reviewing their own performance and in identifying the weak areas, where enough control measure may be taken in future.
In brief, one may say that there is hardly any activity in a manufacturing organisation with which a Cost Accountant is not directly associated in some form or the other.
(ii) (a) Variable and direct cost:
A variable cost is a cost that changes in total in direct proportion to changes in the related total activity or volume. Cost of material is an example of variable cost.
Direct cost is a cost which can be identified either with a cost centre or with a cost unit. An example of direct cost is the allocation of direct materials to a department and then to the various jobs. All variable costs are direct-but each direct cost may not be variable.
(b) Estimated cost and standard cost:
Kohler defines estimated costs as the expected cost of manufacture or acquisition, often in terms of a unit of product computed on the basis of information available in advance of actual production or purchase' Estimated cost are prospective costs since they refer to prediction of costs.
Standard Cost means a pre-determined cost. It attempts to show what the cost should be for clearly defined conditions and circumstances. Standard costs
represent' planned cost of a product. They are expected to be achieved under a particular production process under normal conditions.'
Although pre-determination is the essence of both standard costs and estimated costs, but they differ from each other in the following respects:
|
(i) |
Difference in computation |
|
(ii) |
Difference in emphasis |
|
(iii) |
Difference in use |
|
(iv) |
Difference in records |
|
(v) |
Applicability |
Computation of quarterly and Annual Purchases:
Material 3. (a)
Consumption:
| ||||||||||||||||||||
|
52,000 kg |
|
Annual Purchases: | |||||||||||||||||||||||||||||||||
| |||||||||||||||||||||||||||||||||
|
50,000 kg. Rs. 52,500 | |||||||||||||||||||||||||||||||||
|
Quarter |
Purchase |
Issue (FIFO) |
Closing Stock | ||||||
|
Weight Kg. |
Rate Rs. |
Value Rs |
Weight Kg. |
Rate Rs. |
Value Rs. |
Weight Kg. |
Rate Rs. |
Value Rs. | |
|
Opening Stock |
- |
- |
-- |
4,000 |
1.00 |
4,000 | |||
|
1st quarter |
15,000 |
1.00 |
15,000 |
13,000 |
1.00 |
13,000 |
6,000 |
1.00 |
6,000 |
|
2nd quarter |
25,000 |
1.05 |
26,250 |
f 6,000 13,200 i [7,200 |
1.00 1.05 |
6,000] [ 13,560 7,560J |
17,800 |
1.05 |
18,690 |
|
3rd quarter |
10,000 |
1.125 |
11,250 |
13,200 |
1.05 |
13,860 |
f 4,600 14,600 i [10,000 |
1.05 1.125 |
4,830 ] } 16,080 11,250/ |
|
4th quarter |
f 4,600 12,600 i [8,000 |
1.05 1.125 |
4,830] [ 13,830 9,000J |
2,000 |
1.125 |
2,250 | |||
B
Rs.
160
80
240
16
224
Rs.
240
16
256
1.28
256/200)
Z
Rs.
48
(Rs
Jobs
Y
Rs.
48
15
X
Rs.
64
Rs.
160
15
256
128 51.20
76.8
Statement Showing Earnings of Workers A and B
Workers: A
Rs.
Basic Wages 100 Dearness Allowance
(50% of Basic Wages) 50
Overtime Wages 15 (Refer to Working Note 1)
Gross Wages earned 165 Less: - Provident Fund - 8% of Basic wages
- ESI - 2% of Basic wage _10
Net Wages paid 155
Statement of Labour Cost: Rs.
Gross Wages 150
(excluding overtime)
Employer's Contribution to P.F. and E.S.I. 10
Ordinary wages 160
Labour Rate per hour 0.80
(Rs. 160/200) Statement Showing allocation of Wages to Jobs
Total Wages:
Worker A:
Ordinary Wages: (4 : 3 :3) Overtime Workers B:
Ordinary Wages: (5: 2 : 3)
Labour
4.
192 114.2
431
124.8
Working Notes:
1. Normal Wages are considered as basic wages
2 x (Basic wage + D.A.)
Overtime =-x 10 hours
200
= 2 x (Rs. 150/200) x 10 hours = Rs. 15/-.
Overheads
|
5. Computation of Machine Hour Rate | ||||||||||||||||||
|
|
Set up |
Operation | |
|
Rs. |
Rs. | |
|
Cost per Hour as above |
4.84 |
4.84 |
|
Add: Power 24 Operator's Wages: Rs. |
0.50 | |
|
24 1 | ||
|
Rs. x 8 2 |
3.00 |
1.50 |
|
Comprehensive Rate per Machine Hour |
7.84 |
6.84 |
|
Statement showing Overhead chargeable to the Jobs | ||||||
|
Non-Integrated Accounting
6. Profit & Loss Account of Anamika Manufacturers
for the year ended 30-6-2009
|
To Materials |
1,600 |
By Sales |
|
(20,000 units) | ||
|
To Wages |
800 |
By Closing Stock |
|
To Factory Overheads |
720 |
(Finished Goods |
|
To Office and Admn. Overheads |
416 |
1230 units) |
|
To Selling & Distribution Overheads |
288 |
By Work-in-Progress |
|
To Goodwill written off |
320 | |
|
To Interest on Capital |
32 | |
|
To Net Profit |
176 | |
|
4,352 | ||
|
Profit as |
per Cost |
, Record |
(Rs. in thousands)
4,000
240
112
4,352
Materials Wages Prime Cost Factory Overhead (100% of wages)
(Rs. In thousands) 1,600 800
2,400
800
3,200
3,088
308.80
3,396.80
196.80
3,200.00
320.00
Gross Factory Cost Less: Closing WIP Factory Cost (21,230 units)
Add: Office & Administrative Overhead (10% of Factory Cost)
Total Cost of output Less: Closing stock (1,230 units) of Finished Goods (See Working Note 1)
Cost of Production of 20,000 units Selling and Distribution overhead (@ Rs. 16 p u.)
Cost of sales (20,000 units) Sales Revenue (20,000 units) Profit
4,000.00
480.00
Reconciliation Statement
Rs. (,000) 480
155.2
635.20
459.20
176.00
Profit as per Cost Accounts Add: Factory overhead Overabsorbed (800-720)
Selling and Distribution Overhead Overabsorbed (320-288)
Closing stock overvalued in Financial Accounts (240-196.8)
Less: Office & Administrative Overhead underabsorbed (416-308.80)
Goodwill written off Interest on Capital Profit as per Financial Accounts Working Note:
Total Cost of output Total number of units produced
(i) Cost per unit of finished good =
Cost of 1230 units
Rs.3396.80 Thousand
= Rs. 160
21,230 units Rs. 160 x 1230 = Rs. 1,96,800
Alternatively: Administrative overheads could be excluded from production.
the cost of
Rs.
2,00,000
15.000
25.000
To Materials
To Wages paid and accrued To General expenses To Plant depreciation
By Work-in Progress: Work certified Work uncertified By Materials on hand
Contract Costing 7.
Contract Account of Sheron Limited (for the year ending 30th June, '09)
Rs.
1,00,000
50.000
10.000 5,000
|
To Profit and Loss A/c (See note 2) To Balance c/d 60,000 2,45,000 2,45,000 |
By Contract Escalation (See note 1) |
| ||||||||||||||||||||
|
(Effect of increase in wage rates) 25 Rs.50,000 x 125 |
25,000
= 25% of Increase in Material and wages beyond 5% = 25% of Rs. 20,000 = Rs. 5,000 Calculation of Profit to be transferred:
Total Increase Increase in Contract price
5,000
2
Since the contract is completed between 25% to 50%, one third of the notional profit as reduced by the proportion of cash received to work certified is transferred:
1 Cashreceived
Notional profit x - x-
3 Work certified
Rs. 80,000 x 1 x Rs.1,50,000 = Rs. 20,000 3 Rs.2,00,000
Operating Costing
(1) Total running Kms per month:
|
Km. per |
Trips |
Days per |
Km. per | |
|
trip |
per day |
month |
month | |
|
Delhi to Chandigarh |
150 |
2 |
8 |
2,400 |
|
Delhi to Agra |
120 |
2 |
10 |
2,400 |
|
Delhi to Jaipur |
270 |
2 |
6 |
3,240 8,040 |
|
Passenger Kms. per month | ||||||||||||||||||||||||||||||||
Operating Cost Statement (per month)
Delhi to Chandigarh & Back (50 seats x 2 trips x 8 days) Delhi to Agra & Back (50 seats x 2 trips x 10 days) Delhi to Jaipur & Back (50 seats x 2 trips x 6 days)
1,08,000
1,02,000
1,62,000
3,72,000
Rs.
(2) Passenger Kms. per month:
Fixed Costs:
Rs.
2,800
2,200
200
10,000
400
125
1,000
315
Salary of Driver
Salary of Conductor
Salary of the part-time accountant
20 1
Depreciation (Rs.6,00,000x x )
100 12
Insurance (Rs.4,800 x 1/12)
Road Tax (Rs. 1,500 x 1/12)
Repairs and maintenance Permit Fee Total fixed expenses Variable Costs
17.040
17.040
12,060
804
29.904
29.904
Diesel fRs8,040Kms xRs.6 4Kms
8,040 Kms.
Lubricant Oil (-x Rs.10)
100 Kms.
Total Cost per month Profit and passenger tax together accounts for 50% of total taking p.m. or 100% of cost
Total takings
59,808
11,961.60
17,942.40
Passenger tax (20% of takings)
Profit (30% of takings)
Rate per passenger Km. = :1-= 0.1607741 passenger Km.
Rs. 3,72,000
or (Re. 0.16 say)
Fare to be charged
|
Delhi to Chandigarh, per passenger |
= 150 |
Kms. x |
0.16 |
Rs. |
24 |
|
Delhi to Agra, per passenger |
= 120 |
Kms. x |
0.16 |
Rs. |
0 .2 9. |
|
Delhi to Jaipur, per passenger |
0 7 2 = |
Kms. x |
0.16 |
Rs. |
43.20 |
Process Costing
9. Dr. Process I Account Cr.
|
Particulars |
Total Rs. |
Cost Rs. |
Profit Rs. |
Particulars |
Total Rs. |
Cost Rs. |
Profit Rs. | |
|
To Opening Stock To Direct Materials |
15.000 30.000 22,400 |
15.000 30.000 22,400 |
By Transfer to Process II A/c |
1,08,000 |
81,000 |
27,000 | ||
|
To Direct Wages |
67,400 |
67,400 | ||||||
|
Less : Closing |
7,400 |
7,400 | ||||||
|
Stock Prime Cost |
60,000 21,000 |
60,000 21,000 | ||||||
|
To Overheads To Process Cost To Profit 1 (3 of cost) |
81,000 27,000 |
81,000 |
27,000 | |||||
|
1,08,000 |
81,000 |
27,000 |
1,08,000 |
81,000 |
27,000 | |||
|
Dr. |
Process II Account |
Cr. | ||||||
|
Particulars |
Total Rs. |
Cost Rs. |
Profit Rs. |
Particulars |
Total Rs. |
Cost Rs. |
Profit Rs. | |
|
To Opening Stock To Transfer from Process I A/c To Direct Materials |
18,000 1,08,000 31.500 22.500 |
15.000 81.000 31.500 22.500 |
3.000 27.000 |
By Transfer to Finished Stock A/c |
2,25,000 |
1,51,500 |
73,500 | |
|
To Direct Wages |
1,80,000 |
1,50,000 |
30,000 | |||||
|
Less : Closing Stock |
9,000 |
7,500 |
1,500 | |||||
|
(see note) Prime Cost |
1,71,000 9,000 |
1,42,500 9,000 |
28,500 | |||||
|
To Overheads Process Cost |
1,80,000 45,000 |
1,51,000 |
28,500 45,000 | |||||
|
To Profit (1/4 of cost) |
2,25,000 |
1,51,000 |
73,500 |
2,25,000 |
1,51,500 |
73,500 | ||
|
Particulars |
Total Rs. |
Cost Rs. |
Profit Rs. |
Particulars |
Total Rs. |
Cost Rs. |
Profit Rs. |
|
To Opening Stock To Transfer from Process II A/c |
45,000 2,25,000 |
28,500 1,51,500 |
16.500 73.500 |
By Sales |
2,80,000 |
1,65,000 |
1,15,000 |
|
Less : Closing Stock |
2,70,000 22,500 |
1,80,000 15,000 |
90,000 7,500 | ||||
|
To Profit (balancing figure) |
2,47,500 32,500 |
1,65,000 |
82.500 32.500 | ||||
|
2,80,000 |
1,65,000 |
1,15,000 |
2,80,000 |
1,65,000 |
1,15,000 |
Working Note:
(a) Cost of closing stock has been calculated as under:
Process 11 x Closing stock = 1,50,000 x 9,000 = Rs.7,500.
Total 1,80,000
Finished stock 1,80,000 x 22,500 = Rs.15,000.
2,70,000
(Since process stocks have been valued at prime cost, cost in the above formula means prime cost i.e., cost excluding overhead.)
(b)
Actual Realised Profit:
Rs.
45.000
3,000
48.000
1.500
32.500
16.500
49.000
7.500
Rs.
27,000
Profit from Process I Profit from Process II Add: Reserve for Unrealised Profit on Opening Stock (Figure given)
Less :Reserve for Unrealised Profit on Closing Stock (9,000 - 7,500)
46,500
Profit from Finished Stock Add: Reserve for Unrealised Profit on Opening Stock (figure given)
Less: Reserve for Unrealised Profit on Closing Stock (22,500- 15,000)
41,500
1,15,000
Rs.
7,400
7,500
15,000
29,900
Process I Process II Finished Stock Value of Stock at Cost
Standard Costing
10. Work produced by the gang 1,800 standard labour hours, i.e.,
1,800
|
32 +12 + 6 or36ganghours | ||||||||||||||||||||||||||||||||||||||||||||||||||||||||||||||||||||||||||||||||
| ||||||||||||||||||||||||||||||||||||||||||||||||||||||||||||||||||||||||||||||||
Total Labour Cost Variance Standard Cost - Actual Cost Rs. 4,536 - Rs. 6,960 Labour Efficiency Variance:
(Standard hours for Actual Output - Revised Standard hours) x Standard Rate Skilled (1,152 - 1,280) x Rs. 3 384 A
Semi -skilled (432 - 480) x Rs. 2 96 A
Un-skilled (216 - 240) x Re. 1 24 A
504 A
504 A
(iii) Labour Mix Variance :
(Revised Standard Hours - Actual Hours) x Standard Rate
Skilled
Semi-skilled
Un-skilled
480 F 480 A 80 F 80 F
80 F
(1,280 - 1,120) x Rs. 3 (432 - 480) x Rs. 2 (216 - 240) x Re. 1
(iv) Rate of Wage Variance:
(Standard Rate - Actual Rate) x Actual Hours
1,120 A 720 A 160 A 2,000 A
Skilled
Semi-skilled
Un-skilled
2,000 A 2,424 A
Check : Total Labour Cost Variance = Efficiency + Mix + Rate
(Rs. 3 - Rs. 4) x 1,120 (Rs. 2 - Rs. 3) x 720 (Rs. 1 - Rs. 1) x 160
Marginal Costing
11. (i) In cash break-even chart, only cash fixed costs are considered. Non-cash items like depreciation etc. are excluded from the fixed cost for computation of break-even point. It depicts the level of output or sales at which the sales revenue will equal to total cash outflow. It is computed as under:
Cash Fixed Cost
CashBEP (Units) =
Cost per Units
|
(Rs.) Sales and cos! | 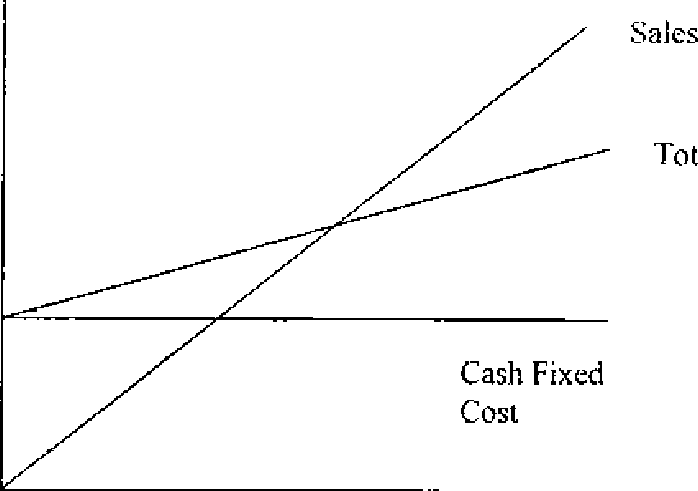 |
Total Cost |
Hence for example suppose insurance has been paid on 1st January, 2006 till 31st December, 2010 then this fixed cost will not be considered as a cash fixed cost for the period 1st January, 2008 to 31st December, 2009.
(ii) It is given in the question that sales quantity in the two years remains the same. The question also does not mention about change in variable cost. Therefore, variable cost in two years will remain the same.
Variable cost in 2008-09 or 2009-10
Total contribution in 2008-09: S x P/V Ratio = C
Or Rs. 8,00,000 x 50% = Contribution
Rs. 4,00,000 Contribution Rs. 4,00,000 Rs. 4,00,000
Sales - Variable cost of sale Rs. 8,00,000 - Variable cost of sale Variable cost of sale in each years
(i) Sales for 2009-10
S x P/V Ratio = Contribution Or Contribution in 2009-10 = 0.375 S and S - V = Contribution
Or S - Rs. 4,00,000 = 0.375 S (Variable cost does not change) Or 0.625 S = Rs. 4,00,000 or S = Rs. 6,40,000
(ii) Margin of Safety = 21.875%
Break-even Sales = 100- 21.875 = 78.125%
Break-even Sales x P/V Ratio = Fixed cost (78.125% of Rs. 6,40,000) x 37.5% = Fixed cost Or Fixed cost = Rs. 1,87,500
(iii) Break-even sales in 2009-10 = 6,40,000 x 0.78125 = Rs. 5,00,000 Budgets and Budgetary Control
12. Flexible Budget
|
Activity Level |
50% |
75% |
100% |
|
Production (units) |
3,200 |
4,800 |
6,400 |
|
Rs. |
Rs. |
Rs. | |
|
Sales @ Rs. 400 per unit |
12,80,000 |
19,20,000 |
25,60,000 |
|
Variable costs: | |||
|
Direct Materials |
2,46,400 |
3,69,600 |
4,92,800 |
|
Direct Labour |
5,12,000 |
7,68,000 |
10,24,000 |
|
Power |
7,200 |
10,800 |
14,400 |
|
Repairs etc. |
8,500 |
12,750 |
17,000 |
|
Other variable cost |
2,700 |
4,050 |
5,400 |
|
Total Variable Costs: |
7,76,800 |
11,65,200 |
15,53,600 |
|
Fixed costs : | |||
|
Manufacturing |
2,06,880 |
2,06,880 |
2,06,880 |
|
Administration, Selling and Distribution |
36,000 |
36,000 |
36,000 |
|
Total Fixed Costs: |
2,42,880 |
2,42,880 |
2,42,880 |
|
Total Costs |
10,19,680 |
14,08,080 |
17,96,480 |
|
Profit (Sales - Variable Cost) - Fixed Cost |
2,60,320 |
5,11,920 |
7,63,520 |
102
|
Attachment: |
| Earning: Approval pending. |