Institute of Chartered Financial Analysts of India (ICFAI) University 2009 MS Finance Cfa - Question Paper
Question Paper Equity: Analysis & Valuation (CFA610) : April 2008
Section A : Basic Concepts (30 Marks)
This section consists of questions with serial number 1 - 30.
Answer all questions.
Each question carries one mark.
Maximum time for answering Section A is 30 Minutes.
1. Business firms in their pursuit of growth, engage in a broad range of restructuring activities. Divestiture is one among them. The term divesture involves which of the following activities?
I. Distribution of shares to the existing shareholders of the parent company.
II. Sale of a portion of the firm through an equity offering to outsiders.
III. Sale of a portion of the firm to an outside third party in consideration of cash or equivalent.
(a) Only (I) above
(b) Only (II) above
(c) Only (III) above
(d) Both (I) and (III) above
(e) All (I), (II) and (III) above.
2. The security market indices are useful for different purposes. Which of the following statements is/are not true?
(a) Security market indices are the basic tools to help and analyze the movements of prices of various stocks listed in stock exchanges
(b) The growth in the secondary market can be measured through the movement of indices
(c) Indices can be calculated company wise to know their trend pattern and also for comparative purposes across the industries and with the market indices
(d) The investors can make their investment decisions accordingly by estimating the realized rate of return on the index between two dates
(e) Funds can be allocated more rationally between stocks with knowledge of the relationship of prices of individual stocks with the movements in the market indices.
3. Arvind Industries Limited has a total capital of Rs.500 lakh. Weighted average cost of capital (WACC) for the company is 13.50% and excess return generated over WACC is 2.50%. The Economic Value Added (EVA) for Arvind Industries is
(a) Rs.10.5 lakh
(b) Rs.12.5 lakh
(c) Rs.55.0 lakh
(d) Rs.67.5 lakh
(e) Rs.80.0 lakh.
4. APSEB has transferred its two businesses; Power generation and Transmission & distribution to two separate companies called APGENCO and APTRANSCO. APSEB cease to exist as a result of the
(a) Split-Offs
(b) Split-Ups
(c) Divestiture
(d) Spin-Offs
(e) Assets sale.
5. There are certain criteria to be met for a company to be included in S&P 500. Which of the following is not a required criterion for a company to be included in S&P 500?
(a) It should have six month period of listing
(b) It should have a part of its share capital with public
(c) It should have sufficient liquidity in quantity of shares traded and frequency with which public trading took place
(d) It should have positive net worth for a period of three years
(e) It should have market capitalization of Rs.500 crore.
6. Vrunda has placed an order to his broker to buy the security at a maximum price of Rs.85 and sell at a minimum price of Rs.90. The type of order given by Vrunda to his broker is
(a) Market order
(b) Stop order
(c) Stop limit order
(d) Limit order
(e) Discretionary order.
7. M\s Mehta steel Ltd. has paid a dividend of Rs.2.75 for the year 2006-07. Required rate of return on a stock is 15.00%. If the stock is currently available at a price of Rs.52, the implied growth rate in dividends is
(a) 6.35%
(b) 7.85%
(c) 9.22%
(d) 9.72%
(e) 10.05%.
8. According to CAPM, a securitys required return is equal to risk free rate of return plus a premium which will be
(a) Equal to securitys beta
(b) Based on total risk of the security
(c) Based on unsystematic risk of the security
(d) Based on systematic risk of the security
(e) Based on securitys market value.
9. Which of the following statements are true with respect to Point and Figure charts (PFC)?
I. A PFC does not have time dimension.
II. A PFC measures every movement in price.
III. The decision about the size of a point is essentially based on price range.
IV. The decision about the size of a point is essentially based on volatility of the stock.
(a) Both (I) and (III) above
(b) Both (II) and (IV) above
(c) (I), (II) and (III) above
(d) (I), (III) and (IV) above
(e) (II), (III) and (IV) above.
10.Which of the following principles is true while analyzing trendline penetrations?
(a) The lesser the number of peaks/troughs that touch a trendline, the greater is its significance
(b) The breadth of a trendline indicates whether a penetration is significant or not
(c) A steep trendline is easily violated by small sideward movements in the price chart, and is not particularly useful in identifying reversals
(d) Penetration of a steep trendline generally results in a corrective movement after which the new trend starts
(e) When the peaks of rallies penetrate, the trend line and then return, the recurrence of this tendency indicates that the trend obeys the trendline.
11.3i InfoTech offered Employee Stock Option (ESOP) to its permanent employees and it was priced at Rs.145 per share of face value Rs.10 each. Which of the following statements is not true with respect to ESOPs?
(a) It reduces the tax burden for smaller companies
(b) It is involved in mergers and LBOs as a financing vehicle for the acquisition of companies
(c) It is an incentive for employees to become more productive
(d) It acts as an anti take over defense
(e) It reduces the amount of capital to the company.
12.Which of the following is not a characteristic of a joint venture?
(a) Both the partners lose their own corporate identity and autonomy
(b) Financial risk and rewards are allocated to each member
(c) It is an independent legal entity in the form of a corporation or partnership
(d) Management of the enterprise is controlled by anyone of the partners
(e) Joint property interest lies in the subject matter of the venture.
13.The intrinsic value of the stocks are the estimates of EPS and P/E multiple. Which of the following would you consider the best indicator of an under valued firm?
(a) A firm with a P/E ratio lower than the market average
(b) A firm with a P/E ratio lower than the average P/E ratio for the firms peer group
(c) A firm with a lower P/E ratio, a lower expected growth rate and lower risk than its peer group
(d) A firm with a lower P/E ratio, a higher expected growth rate and higher risk than its peer group
(e) A firm with a lower P/E ratio, a higher expected growth rate and lower risk than its peer group.
14.Consider the following financials pertaining to a firm:
|
Stable growth rate |
5% |
|
Dividend pay-out ratio |
25% |
|
Net profit margin |
10% |
|
Required rate of return |
12% |
Based on the above information, P/S ratio of the firm is
|
(a) |
0.225 |
|
(b) |
0.310 |
|
(c) |
0.338 |
|
(d) |
0.375 |
|
(e) |
0.420 |
15.Nagarjuna Fertilizers reported an EPS of Rs.50.65 and paid dividend of Rs.12 last year. The capital expenditure per share was Rs. 115 and depreciation was Rs.91.12 per share.
The working capital increased by Rs.4.48 per share. Management wanted its financial risk to be limited, so it maintained a debt ratio of 11.40%. Calculate the free cash flow for equity (FCFE).
|
(a) |
26.03 |
|
(b) |
25.52 |
|
(c) |
25.20 |
|
(d) |
24.32 |
|
(e) |
23.80 |
16.Current P/E ratio of Patni Computers is 12. If its expected P/E ratio exceeds the stocks current P/E, which of the following statements is/are true?
I. Stock is overpriced.
II. It is time to buy the stock.
III. The stock is correctly priced.
(a) Only (I) above
(b) Only (II) above
(c) Only (III) above
(d) Both (I) and (II) above
(e) Both (II) and (III) above.
(a) There will be a possibility for considerable selling pressure from institutions and index funds immediately after the spin-off
(b) The new company formed by the spin off need not incur expenses for issuing new shares
(c) Servicing the shareholders leads to duplication of the activities in parent and the spin-off company
(d) A spin off is often perceived as a method for getting rid of a sub-par asset by the parent
(e) As shares are distributed primarily to existing shareholders, spin-off lack liquidity.
18.Closing prices for the stock of Zen Ltd. are given below:
|
Day |
Closing Price (Rs.) |
|
1 |
230.50 |
|
2 |
235.50 |
|
3 |
222.10 |
|
4 |
225.10 |
|
5 |
230.10 |
The relative strength of the stock is
(a) 0.9156
(b) 0.9980
(c) 1.0142
(d) 1.0366
(e) 1.0424.
19.Genex Ltd has an asset turnover of 1.7, net profit margin of 18%, total assets of Rs.12 million and total debt of Rs.6 million. The return on equity of Genex Ltd is
(a) 15.30%
(b) 24.25%
(c) 45.20%
(d) 61.20%
(e) 66.20%.
20.The correlation coefficient of return on stock with market return is negative. Which of the following is the implication of the given statement?
(a) On an average, the returns from stock and market move in opposite directions
(b) The average risk of stock is less than the market risk
(c) The average return of stock is more than the market return
(d) Stock has given an above normal return
(e) Stock has given a below normal return.
21.M/s Khimani Forge Ltd. has paid a dividend of Rs.3.5 per share on a face value of Rs.10 during Financial Year ended 31st March, 2007. The following is the data of the company and the market:
|
Current market price of share |
Rs.75 |
|
Growth rate of earnings and dividends for next three years |
7.50% |
|
Stable growth rate |
5% |
|
Beta of share |
0.95 |
|
Average market return |
12.50% |
|
Risk free rate |
6% |
|
The |
intrinsic value |
|
(a) |
Rs.54.73 |
|
(b) |
Rs.63.52 |
|
(c) |
Rs.68.40 |
|
(d) |
Rs.72.36 |
|
(e) |
Rs.75.63. |
22.The structure of the leveraged buyout (LBO) is aimed at optimizing the relationship between a companys capital structure and equity values realizable by both its current shareholders and prospective future shareholders. Leveraged buyouts can be divided into following three categories depending on the probable mechanism for debt repayment and the realization of value to equity:
I. Bust-up LBOs.
II. Cash Flow LBOs.
III. Selective Bust-up/Cash Flow LBOs.
Which of the aforementioned kind of LBOs depend only on the sale of assets of the acquired company to generate returns?
(a) Only (I) above
(b) Only (II) above
(c) Only (III) above
(d) Both (I) and (II) above
(e) Both (I) and (III) above.
23.Which of the following is/are not a clear bearish signal?
|
I. |
Triangle. |
|
II. |
Double bottom. |
|
III. |
Head & Shoulders. |
|
(a) |
Only (I) above |
|
(b) |
Only (II) above |
|
(c) |
Only (III) above |
|
(d) |
Both (I) and (II) above |
|
(e) |
Both (II) and (III) above |
24.A convertible bond with a face value of Rs.1,000 had been issued at Rs.1,200 with a coupon rate of 10%. The conversion rate is 20 shares per bond. The current market price of the bond is Rs.1,300 and that of stock is Rs.55. The premium over conversion value is
(a) 9.09%
(b) 18.18%
(c) 20.00%
(d) 23.15%
(e) 30.00%.
25.Following are the details pertaining to a convertible bond:
|
Market price of 10% bond |
Rs. 112 |
|
Current stock price |
Rs.22 |
|
Dividend paid |
Rs.0.85 |
|
Premium over conversion |
18% |
The pay back period will be
(a) 2.40 Yrs
(b) 2.60 Yrs
(c) 2.70 Yrs
(d) 3.20 Yrs
(e) 3.40 Yrs.
26.Which of the following statements is true regarding the semi-strong from of Efficient Market Hypothesis?
(a) Stock prices fully reflect all historical price information
(b) Runs test is used to test the semi-strong form of market efficiency
(c) Stock prices fully reflect all relevant information including insider information
(d) Stock prices are not predictable using the publicly available information
(e) Relationship between the historical P/E ratios and risk-adjusted market performance supports semi-strong form of market efficiency.
27.Which of the following statements is false with respect to the two-stage dividend discount model?
(a) It is difficult to specify the supernormal growth period with precision
(b) The model suffers with the limitation of the change of high supernormal growth to a lower stable growth rate at the end of the supernormal growth period
(c) The terminal price calculated in this model is derived from Gordon model
(d) This model is best suited to those firms which have a high growth rate in the beginning and a gradual decline in the growth rate over a period of time
(e) This model assumes high-growth period and stable-growth period for valuing a stock.
28.The relationship between the price and the book value has often helped the investors in parking their funds. Which of the following statement(s) is/are false with respect to Price to Book Value (P/BV) ratio?
I. P/BV ratio can be calculated even for firms with negative earnings.
II. If a firm has continuous negative earnings, the book value of equity can become negative leading to a negative P/BV ratio.
III. When the required rate of return is high the P/BV ratio goes up.
(a) Only (I) above
(b) Only (III) above
(c) Both (I) and (II) above
(d) Both (I) and (III) above
(e) All (I), (II) and (III) above.
29. Although exit and entry barriers are conceptually different, their joint level is an important aspect of the analysis of an industry. Which of the following is most likely true, if entry barriers are low and exit barriers are high in the industry?
(a) Returns are low and stable
(b) Returns are high and stable
(c) Returns are low and risky
(d) Returns are high and risky
(e) Returns may vary depending on industry selected.
30.Which of the following statements is/are true according to H model?
I. According to the model, if the current growth rate is greater than the normal long run growth rate, the growth rate eventually decreases.
II. In the model, we make an assumption that in H years the growth decreases from the abnormal growth rate to the normal growth rate.
III. The intrinsic value of a share according to the model is equal to the value based on the normal growth rate
plus premium due to abnormal growth rate.
(a) Only (I) above
(b) Only (II) above
(c) Both (I) and (II) above
(d) Both (I) and (III) above
(e) All (I), (II) and (III) above.
END OF SECTION A
Section B : Problems/Caselet (50 Marks)
This section consists of questions with serial number 1 - 6.
Answer all questions.
Marks are indicated against each question.
Detailed workings/explanation should form part of your answer.
Do not spend more than 110 - 120 minutes on Section B.
|
1.Mr. Aman, an analyst is considering two stocks, Infosys and Satyam for investing. Expected returns on these stocks depend on the growth rate of the GDP. The conditional returns of the stocks and the market index are given below: | ||||||||||||||||||||||||||||
| ||||||||||||||||||||||||||||
The expected risk-free return is 6.0 percent. Assume that the CAPM holds good in the market.
You are required to:
a. Estimate standard deviation of returns and betas of the stocks.
(8marks)
(4marks)
b. Determine the excess return per unit of risk for both the stocks. Which stock should the analyst select?
2.Escorts Multimedia Ltd., is considering the acquisition of Prudential Advertising Ltd., in a stock-for-stock transaction in which Prudential Advertising Ltd., would receive Rs.84.30 for each share of its common stock. The Escorts Multimedia Ltd., does not expect any change in its P/E multiple after the merger and chooses to value the Prudential Advertising Ltd., conservatively by assuming no earnings growth due to synergy.
|
You are provided with the following information: | ||||||||||||
| ||||||||||||
|
You are required to calculate |
a. i. Post-merger share price.
ii. Post-merger equity ownership distribution.
iii. Purchase price premium.
(7marks)
(2marks)
b. Comment on the decision taken by the Escorts Multimedia Inc.
|
3.The data given below relates to the stock prices of United Capital on trading days of January 2006 and January 2008. | ||||||||||||||||||||||||||||||||||||||||||||||||||||||||||||||||||||
|
You are required to test the efficiency of market in its weak form using Auto-Correlation test.
(9marks)
4.Santa Limited, with fast food restaurants throughout the country, reported a net profit of Rs.108.5 crore on sales of Rs.742.5 crore. The sales/book value ratio of the firm is approximately 1.2, and the dividend payout ratio is 20%. The book value per share is Rs.19. The firm is expected to maintain high growth for ten years as per the dynamic growth model, during which it will maintain the current dividend payout ratio. After the high growth period, the growth rate is expected to drop to 6%, and the dividend payout ratio is expected to be 65%. The beta of the stock is 1.05.
The 1 year treasury bill rate is 7% and premium on market portfolio is 5.5%.
You are required to Estimate the price/sales ratio for Santa based upon its characteristics.
(8marks)
(6marks)
(6marks)
Read the caselet carefully and answer the following questions:
5.With respect to the caselet, explain the benefits of online trading.
6.Considering the various issues mentioned in the caselet, analyse the challenges associated with online trading.
When I took office, only high energy physicists had ever heard of what is called the World Wide Web. Now even my cat has its own page. Bill Clinton.
The Internet is creating a revolution in commerce. The financial securities industry is at the forefront of this revolution. The Internet-based trading facility permits buying and selling of shares through an online broker. Charles Schwab and e-Trade were pioneers in the field of online trading. The traditional brokers also resorted to providing Internet-based service and the industry witnessed many competitors following suit. These online trading portals have made an impact on the financial services industry. The Banking Act of 1933 prevented banks and investment banking companies to hold same ownership. Later, this was removed in 1999 by the Financial Services Modernization Act. This led to several large scale mergers of the US securities firms as banks were keen on converting their business to separate entities.
In the US, there have been several "pump and dump" and touting Internet frauds.
For instance, in the year 2000, a teenager manipulated stock prices through spam mails using the names of some established authors. The stock prices spiraled and he made a huge profit. The Securities Exchange Commission (SEC) made him return $285,000. The SEC has taken efforts to protect the investors against internet frauds through the Internet Enforcement Program. Increasing corporate governance through disclosure, requiring brokerage firms to execute trades quickly to ensure best prices, and requiring them to meet the customer's expectations are some reform measures that the SEC has initiated.
Milan, the Italian stock exchange, is the fourth largest stock market in Europe. A collapse of its electronic trading system in the year 2000 caused the market to be closed for eight hours. In the year 2006, regulators of Canada stock market identified a stock scam in which the accounts of four brokers were attacked following a manipulation of a stock's price to create artificial demand. The online brokers were victims to tricks through which their client account information was captured. The Indian stock market crash of Black Monday had the 30-share index fall by 1,111.70 points in the course of the day. Electronic trading was suspended for two hours to enable the market to pick up in the interest of the investors, similar to the New York Stock Exchange which closed for three working days after the 9/11 attacks.
Obtaining an allotment on an IPO was difficult in India, as it had a good demand from the retail investors. Among the online brokerage firms, SEBI has identified IndiaBulls and Karvy as the financiers involved in the IPO scam of 2006. Several thousand demat accounts were opened in a short while and closed as soon as the IPO allotment was made. The brokerage firms made volumes based on the confidence of the investors. It is anticipated that the brokerage firms mentioned by SEBI would find their customers switching to other brokers. The online trading industry by itself would, however, remain unaffected by the IPO scam. International cooperation among policy makers will greatly reduce Internet fraud which is essential when the capital market operations are taking place globally.
An online trading portal can be successful only if it provides a range of services for the end user at a competitive cost. The service provider must also update his technology to meet the demands of
growing volumes. Online investors must take into account the safety, speed of execution, and the brokerage cost before deciding on the online broking company. Compared to online trading, direct access trading systems provide more advantages through faster information and execution of the trade. Stockbrokers must add value in alternative ways if they are to be useful to their customers. Charts and news with other useful tools made available through the online broking companies which educate the present investors on online stock trading that enables real-time results. Investment opportunities include putting money into a savings account, buying stocks and bonds, or mutual funds, and several other ways of investment.
END OF CASELET
END OF SECTION B
Section C : Applied Theory (20 Marks)
This section consists of questions with serial number 7 - 8. Answer all questions.
Marks are indicated against each question.
Do not spend more than 25 - 30 minutes on Section C.
7. Many industry analysts believe that industries evolve through four stages of complete life cycle. Infact, the concept of an industry life cycle can be applied to industries or product line within industries. Describe briefly the four stages of
industry life cycle. (10 marks)
8. Identification of support and resistance levels is an important application of trend line. Enumerate the importance of support and resistance lines in technical analysis
and also discuss the principles involved while using these for trend analysis. (10 marks)
END OF SECTION C
END OF QUESTION PAPER
Suggested Answers Equity: Analysis & Valuation (CFA610) : April 2008
Answer Reason
C Distribution of shares to the existing shareholders of the parent company happens in spin-off and Sale of a portion of the firm through an equity offering in equity carve-out. Therefore, only statement (III) is true with respect to divestitures.
1
C Indices can be calculate industry-wise to know their trend pattern and also for comparative purposes across the industries and with the market indices. All other statements are true. Therefore, option (c) is correct.
2
3. B EVA = excess return generated over WACC = 500 X 0.025 = Rs. 12.5 lakh.
A split-up involves the creation of a new class of stock for each of the parent operating subsidiaries, dissolving the parent company.
In split-offs a new company is created to takeover the operations of an existing division or unit.
A divestiture is a sale of a portion of the firm to an outside party, generally resulting in an infusion of cash to the parent company.
A spin-off is a transaction in which a company distributes on a pro-rata basis all of the shares it owns in a subsidiary to its own shareholders.
Asset sale involves the sale of tangible or intangible assets of a company to generate cash.
Therefore, option (b) is correct.
Statement (e) is the characteristic required to be fulfilled by a company in order to be included in S&P 50 and not in S&P 500.
5
E
The important characteristics of the companies to be included in S&P 500 are as below; It should have six month period of listing.
It should have a part of its share capital with public.
It should have sufficient liquidity in quantity of shares traded and frequency with which public trading took place.
It should have positive net worth for a period of three years.
Hence, option (e) is the correct answer.
In case of stop limit order to sell, the investor can specify the minimum price he will accept and for stop order to buy, he specifies the maximum price that he is ready to pay for the stock.
6
C
The order to buy or sell at the best current market price is the market order.
A stop order to sell becomes a market order when the market price goes below spot order price and for sell vice versa.
In limit orders, investor specifies the limit at which he would like his stock to be traded.
In discretionary order the broker has the discretion to decide whether to buy or sell the security also its price.
C
7
Dp (1 + g)
D ke g
2.75(1 + g)
52
0.15 g
1+g
52
2.75 0.15 g
1 + g _ 0.15 g
18.909 _
2.836 - 18.909g _ 1 + g 1.836
19.909 _ g g _ 9.22%.
D As per CAPM, securitys required rate of return is equal to risk free rate plus a premium based on the systematic risk of the security. Hence, option (d) is the answer.
10.
C
11.
E
12.
13.
14.
15.
D
E
D
P/S ratio
: 0.375.
B
16.
17.
18.
B
B
D
Relative strength of the stock = [235.50 + 225.10 + 230.10/3]
222.10
PFC records changes in prices that are larger than a specific amount. All other statements are true with respect to Point and Figure Chart. Statement II is incorrect. A PFC does not measure every movement in price.
Therefore, Option (d) is the correct answer.
Alternative (c) is correct as a steep trendline is easily violated by small sideward movements in the price chart, and is not particularly useful in identifying reversals.
Alternative (a) is not correct as more than number of peaks and trough that touch a trend line greater its significance.
Alternative (b) is not correct as it is not breadth but the length of the trend line which indicates whether a penetration is significant or not.
Alternative (d) is not correct as penetration of steep trend line results in a corrective movement after which the previous trend continues.
Alternative (e) is not correct as the peaks of rallies when penetrate the trend line that indicates shift in trend.
An Employee Stock Option plan is a mechanism whereby a corporation can make a tax deductable contribution of cash or stock into a trust. These stocks are allocated to employees and are not taxed until withdrawn by them. It does not reduce the amount of capital to the company. ESOPs are involved in mergers and LBOs as a financing vehicle for the acquisition of companies and as an anti take over defense.
Hence, the alternative (e) is not true and the answer of this question too.
Joint venture entity is managed by separate management team. Hence option (d) is false and all other options are correct.
A firm with a lower P/E ratio, a higher expected growth rate, lower risk than its peer group can be considered as the best indicator of an under valued firm.
0.10x0.25x1.05
FCFE = Net Income -(1-b)(CAPEX-Depreciation) - (1-b)(Change in Working Capital)
= 50.65-(1-0.114)(115-91.12)-(1-0.114)(4.48)
=50.65-21.16-3.97
=25.52.
If the E(P/E) ratio is greater than the actual P/E ratio, it indicates that the stock is underpriced and this is the time to buy the stock. If the E(P/E) ratio is less than the actual P/E, the stock is currently overpriced and it is the time to sell the stock. Hence statements (I) and (III) are incorrect whereas statement (II) is correct.
Therefore option (b) is the answer.
The new company formed by the spin off has to incur expenses for issuing new shares.Hence, option (b) is incorrect. All other statements are correct.
Average of up-closing prices Average of down-closing prices 230.23 = 222-10 =1.0366
0.12 - 0.05
Using the Du Pont model, Return on Equity (ROE) is calculated as ROE= Net Profit margin x Total assets Turnover x Financial leverage Financial leverage = Total assets/Equity = [12/(12-6)] = 2
ROE =0.18x1.7x2 = 0.612 (i.e. 61.20%).
Correlation coefficient between two securities measures the relationship between the securities. If this coefficient is positive it indicates the returns on the securities move in the same direction and if it is negative it indicates that the returns on the securities move in the opposite direction. If the correlation coefficient of return on a stock with the returns on the market is negative, it indicates that the returns on the stock and the market move in the opposite direction. Hence, (a) is correct.
21.
A
3.76
4.04
4.35
4.57
- + -
+
+
Intrinsic value _ (L1218) (L1218) (L1218) d-1218JC0.1218 0.05)
_Rs.54.73
Bust-Up LBOs: LBOs of this kind depend on the sale of assets of the acquired company to generate returns for the equity investors.
Cash Flow LBOs: Cash flow LBOs is a second category of leveraged buyout which is most common in management led transactions that requires repayment of acquisition financing through the operating cash flows.
Selective Bust-up/Cash Flow LBOs (Hybrid): It involves the purchase of a fairly diversified company and the subsequent divesture of selected units to retire a portion of the acquisition debt.
Head and Shoulders and Double Top are technical indicators which indicate bearish market. Double bottom indicates a bull market and triangles are commonly used to identify reversals and consolidation but are not very reliable formation. Therefore, option (d) is the answer.
Bondprice-Conversion value
, Conversion value
Premium over conversion value _
Where conversion value _ Current market price of the stock x Conversion rate Conversion value _ 55 x 20 _ Rs.1, 100
22.
A
23.
D
24.
B
1300 1100 Premium over conversion value _ 1100
% Pr emium 1 + % Pr emium
_ 18.18%.
25.
C
DividendYield 1 + % Pr emium
CurrentYield
Payback period = Currentyield =
10
112
= 0.0892
0 85
DividendYield = = 0.0386 22
0.18
Payback period
_ 2.70 Years.
26. D As per the weak form of efficiency theory, stock prices fully reflect all historical price information. Run test is used to test the weak form of EMH.
Super strong form of efficiency stock prices fully reflects all relevant information including insider information.
Semi-strong form of efficiency implies that market prices reflect all publicly available information concerning past trading as well as fundamental aspects of the firm. Hence stock prices are not predictable using the publicly available information.
Relationship between the historical P/E ratios and risk-adjusted market performance is evidence against the semi-strong form of market efficiency.
Hence (d) is the answer.
27. D Option ((dOption (d) describes the characteristics of the H-model. Two-stage dividend
discount model is most suitable to firms that register high growth and they also expect to maintain this growth rate for a certain period of time after the growth rate tends to decline.
It is difficult to specify the supernormal growth period with precision since the growth rate is expected to reduce to stable level after this period.
The model suffers with the limitation of the change of high supernormal growth to a lower stable growth rate at the end of the supernormal growth period.
The terminal price calculated in this model is derived from Gordon model and hence it suffers from the limitation of the Gordon model.
This model assumes two-stage i.e. high-growth period and stable-growth period for valuing a stock.
Therefore, Option (d) is the correct answer.
28. B P/BV ratio is affected by the required rate of return. When the required rate of return is
high, P/BV ratio goes down. Other two statements are true. Hence, option (b) is the answer.
29. C
|
Exit barriers | |||
|
Low |
High | ||
|
Entry barriers |
Low |
Low, stable returns |
Low, risky returns |
|
High |
High, stable returns |
High, risky returns |
Therefore, Option (c) is the correct answer.
30. D According to H model there are two phases of growth - abnormal growth rate and long run normal growth rate and it is assumed that in 2H years the growth decreases from abnormal growth rate to normal growth rate.
Hence, statement (II) is not correct.
|
1.a. INFOSYS | ||||||||||||||||||||||||||||||||||||||||||||||||||||||||||||
| ||||||||||||||||||||||||||||||||||||||||||||||||||||||||||||
|
= S PXrm = | ||||||||||||||||||||||||||||||||||||||||||||||||||||||||||||
Mean (ra) = ! = 20.10 10.90
Mean (rm ) =
S (r- r )2 xp =
S (rm - rm )2 XP.
Variance
= 412.98
Variance
117.79
= V412.98 =
V117.79 =
Standard Deviation = 10.85
Standard Deviation
= 20.32
S (r - r )(rm - rm ) XP Covariance = = 220.51
cov.
2
o
|
Beta = ~m = 1.8721 SATYAM | ||||||||||||||||||||||||||||||||||||||||||||||||||||||||||||
| ||||||||||||||||||||||||||||||||||||||||||||||||||||||||||||
|
, = S PXrs = ' Mean ( rm ) = = S PXrm = | ||||||||||||||||||||||||||||||||||||||||||||||||||||||||||||
Mean (ra) = 's = 7.40 10.90
S (rs - rs )2 XP =
S (rm - rm )2 XP.
Variance
= 40.44
Variance
117.79
= -740.44 =
iation = 117.79 =
Standard Deviation = 10.85
Standard Deviation =
= 6.36
S (rs - rs )(rm - rm ) XP
Covariance =
= -59.46
INFOSYS
r + R( r r )
b.
Required return = f m fJ = 6.00+[1.8721(10.90-6.00)] = 15.17 Excess return = (Expected return - required return) = (20.10-15.17) = 4.93 Excess return 4.93 Standard deviation _ 20.32 _ 0.2426 SATYAM
r + B( r r )
Required return = f m fJ _ 6.00+ [-0.5048(10.90-6.00)] = 3.53 Excess return = (Expected return - required return) = 7.40-3.53 =3.87 Excess return 3.87 Standard deviation _ 6.36 _ 0.6085
As the Excess return to Standard deviation is higher for the stock of Satyam, Mr. Aman should choose Satyams stock.
Post merger share price = Post merger EPS x Premerger P/E.
2.a.
.
Price per share offered for Target Company
r n .. Market Price per shareof theacquiring company
Exchange Ratio =
Rs.84.30 = Rs.56.25 = 15 Acquiring company issues 1.5 shares of stock for each share of target company stock.
New shares issued by Acquiring Company = Shares of Target Company x Exchange Ratio = 18750 x 1.5 = 28,125.
Total shares outstanding of the combined companies = Acquiring company shares + New shares of Target Company 112000+ 28125 = 140125.
Post merger EPS of the combined companies
Earnings available for common stock of acquiring company + Earning available of target company = Total shares outstanding of combined companies after acquisition
Rs.281500 + Rs.62500 = 140125
Rs.344000 = 140125 = Rs.2.45.
Earnings of company
No. of shares of acquiring company
Premerger EPS of Escorts Multimedia =
Rs.281500 = ll2000 = rs.2.51.
Premerger Price Per Share
n Premerger Earnings PerShare
Premerger P/E = & &
Rs.56.25
= Rs.2.51 = 22.4
Post merger share price = Post merger EPS x Premerger P/E
= Rs.2.46 x 22.4 = Rs.54.88
ii. Post merger equity ownership distribution
New shares received
u- a i aj T * TotalNo.of sharesoutstanding of the combined companies
Ownership of Prudential Advertising List= 1
28125 = 140125 = 20.1%
Ownership of acquiring company = (100 - 20.1%) = 79.9%.
Offer price for target company stock
, , Target company market price per share
iii. Purchase price premium = 1-
Rs.84.30
= 1- Rs.62.50 = 0.35 or 35%
b. The acquisition results in Rs.1.37 (Rs.56.25 - Rs.54.88) reduction in the share price of the acquiring company due to Rs.0.06 (Rs.2.51 - Rs.2.45) decline in EPS of the combined companies. (Recall that acquiring company assumed no gains in earnings of the combined companies due to synergy) whether the acquisition is a poor decision depends upon what happens to the earnings of the combined companies over time. If the combined companies earnings grow more rapidly than the acquiring companys earnings would have in the absence of the acquisition, the acquisition may contribute to the market value of the acquiring company.
|
Price change |
Price change |
X2 |
Y2 |
XY |
|
(in X) |
(in Y) | |||
|
2.600 |
2.450 |
6.760 |
6.003 |
6.370 |
|
1.450 |
0.600 |
2.103 |
0.360 |
0.870 |
|
0.050 |
29.100 |
0.003 |
846.810 |
1.455 |
|
-2.000 |
-14.200 |
4.000 |
201.640 |
28.400 |
|
-0.750 |
9.850 |
0.563 |
97.023 |
-7.388 |
|
-1.850 |
-1.950 |
3.423 |
3.803 |
3.608 |
|
0.350 |
4.200 |
0.123 |
17.640 |
1.470 |
|
0.000 |
4.300 |
0.000 |
18.490 |
0.000 |
|
1.800 |
-11.200 |
3.240 |
125.440 |
-20.160 |
|
-2.150 |
-0.200 |
4.623 |
0.040 |
0.430 |
|
2.100 |
5.150 |
4.410 |
26.523 |
10.815 |
|
1.200 |
5.950 |
1.440 |
35.403 |
7.140 |
|
-1.400 |
-1.600 |
1.960 |
2.560 |
2.240 |
|
-2.800 |
-11.500 |
7.840 |
132.250 |
32.200 |
|
-0.900 |
6.350 |
0.810 |
40.323 |
-5.715 |
IX =-2.30 X =-0.153 IX2 = 41.298 IXY = 61.735 IY = 27.30 Y = 1.820 IY2 = 1554.305
Z XY - nXY 61.735 -15(-0.153)(1.82) 65.9119 ,
b =-=-2 =-= 1-6097
Z X2 - nX 2 41.298 -15(-0.153)2 40.9469
a = Y - bX = 1.82 -1.6097(-0.153) = 2.0663
2 2 a Z Y + b Z XY - nY (2.0663 x 27.30) + (1.6097x61.735) - 15(1.82)2
2
r =
Z Y2 - nY2 1554.305 - 15(1.82)2
= 56.4010 + 99.3748 - 49.686 = Q Q7Q5 = 1554.305 - 49.686 = ' r = 0.2655
As it can be seen that the correlation between the prices in two different periods is small, we can conclude that prices in the two periods were independent and moved in a random fashion and market is relatively efficient in its weak form.
4.
|
Particulars |
Next ten years |
After ten years |
|
Payout Ratio |
20.00% |
65.00% |
|
Expected Growth Rate1 |
14.03% |
6.00% |
|
Cost of Equity2 |
12.775% |
12.775% |
|
Profit Margin3 |
14.61% |
14.61% |
Working Notes:
1. ROE = Net Profit Margin x Sales/Book value
Expected Growth rate = (1 - Payout ratio) x Net Profit Margin x Sales/Book Value
(1 - 0.20 )xx1.2 = 742.5 = 0.1403
2. Cost of Equity = Rf +P(Rm -rf) = 7 + 1.05(5.5) = 12.78%
Profit 108.5
3. Profit Margin = Sales = 742.5 = 14.61%
Book value of the Santas shares = Rs. 19
Sales 742.5
Total book value of the shares = Sales/BookValue = 12 = Rs.618.75 crore
618.75
So, the number of shares outstanding = 19 = 32.5657895 108.5
Earnings per share = 32.5657895 = Rs.3.33
Share Price using Dividend Discount Model:
|
Year |
1 |
2 |
3 |
4 |
5 |
6 |
7 |
8 |
9 |
10 |
|
EPS |
3.797 |
4.33 |
4.937 |
5.63 |
6.42 |
7.32 |
8.35 |
9.52 |
10.86 |
12.38 |
|
DPS |
0.7594 |
0.866 |
0.9874 |
1.126 |
1.284 |
1.464 |
1.67 |
1.904 |
2.172 |
2.476 |
|
PV |
0.6733 |
0.6809 |
0.6883 |
0.6960 |
0.7037 |
0.7115 |
0.7196 |
0.7275 |
0.7358 |
0.7438 |
Terminal Value _ (0.1278 0.06) _ 125.81
125.81
Present Value of Terminal Value _ (1 1278) _ 37.79 So, the share price of Santas would be
0.6733+0.6809+0.6883+0.6960+0.7037+0.7115+0.7196+0.7275+0.7358+0.7438+ 37.79 _ Rs.44.87 Share price x Number of Shares Outs tan ding So, Price/Sales Ratio _ TotalSales
44.87 x 32.5657895 _ 742-5 _ 1.97
5.Benefits of Online Trading
The reason for growing financial securities industry is because all the investors are treated uniformly irrespective of the size of the transactions. The low cost of these online brokerage firms gives a competitive edge upon the traditional broker. The price of a stock through online trading is different from that through traditional broker. This makes the cost of trade cheaper through online trading than traditional. Online trading saves the time of the broker as information is easily available. An investor has ample opportunity to disseminate information and act quickly on his own personal research and can have complete control over his investments. The system passes on the benefits of real-time trading to the ultimate consumer. Ease of use, considerable time savings above traditional full trade service and host of supplementary services offered over the Internet are some of the reasons why more and more people are choosing online trading as a method to trade. It improves the market timing and is a lot cheaper as it offers reduction in overheads. It provides large variety of trading opportunities and increases profit potential of trade. It puts the investor in complete control of his or her trading decisions. Online trading enables seamless trading and seamless settlement. It is particularly convenient when there is T+2 settlement system.
6.Failure to process online trading instructions, excessive delay in executing, inability to access online trading accounts, inability to reach the brokers through e-mail or telephone and erroneous processing of online trading instructions and the investor's own inexperience are some of the inherent problems of online trading. The risk concerned with online trading is connected to share price volatility, depending upon the rise and fall of online trading over the time. The safety of transactions on the Internet depends on the encryption system used. Some fraudulent practices take place due to Internet technology. It includes, offering securities which do not exist, spreading wrong information which results in easier price rigging, and making unrealistic offers which are misleading.
7. Many observers believe that industries evolve through four stages - the pioneering stage, the expansion stage, the stabilization stage and the declining stage. There is an obvious parallel in this idea to human development. The concept of an industry life cycle could apply to industries or product lines within industries.
Pioneering Stage
In this stage, rapid growth in demand occurs. Although a number of companies within a growing industry will fail at this stage because they will not survive the competitive pressures, most experience rapid growth in sales and earnings, possibly at an increasing rate. The opportunities available may attract a number of companies, as well as venture capital. Considerable jockeying for position occurs as the companies battle each other for survival, with the weaker firms failing and dropping out. Investor risk in an unproven company is high, but so are expected returns if the company succeeds. At the pioneering stage of an industry it can be difficult for security analysts to identify the likely survivors, just when the ability to identify the future strong performers is most valuable. By the time it becomes apparent who the real winners are, their prices may have been bid up considerably beyond what they were in the earlier stages of development.
Expansion Stage
In this second stage of an industrys life cycle the survivors from the pioneering stage are identifiable. They continue to grow and prosper, but the rate of growth is more moderate than before. At the expansion stage of the cycle, industries are improving their product and perhaps lowering their prices. They are more stable and solid, and at this stage they often attract considerable investment funds. Investors are more willing to invest in these industries now that their potential has been demonstrated and the risk of failure has decreased.
Financial policies become firmly established at this stage. The capital base is widened and strengthened dividends often become payable, further enhancing the attractiveness of these companies to a number of investors.
Stabilization Stage
Finally, industries evolve into the stabilization stage (sometimes referred to as the maturity stage), at which the growth begins to moderate. Sales may still be increasing, but at a much slower rate than before. Products become more standardized and less innovative, the market place is full of competitors, and costs are stable rather than decreasing through efficiency moves and so on. Industries at this stage continue to move along, but without significant growth.
Stagnation may occur for considerable periods of time, or intermittently.
This three-part classification of industry evolvement is helpful to investors in assessing the growth potential of different companies in an industry. Based on the stage of the industry, they can better assess the potential of companies within that industry. However, there are limitations to this type of analysis. First, it is only a generalization, and investors must be careful not to attempt to categorize every industry, or all companies within a particular industry, into neat categories that may not apply. Second, even the general framework may not apply to some industries that are not categorized by many small companies struggling for survival. Finally, the bottom line in security analysis is stock prices, a function of the expected stream of the benefits and risk involved. The industrial life cycle tends to focus on sales and share of the market and investment in the industry. Although all of these factors are important to investor, they are not the final items of interest. Given these qualifications to industry life cycle analysis, what are the implications to investors?
The pioneering stage may offer the highest potential returns, but also offers the greatest risk. Several companies in a particular industry will fail, or do poorly. Such risk may be appropriate for some investors, but many will wish to avoid the risk inherent in this stage.
The maturity stage is to be avoided by investors interested primarily in capital gains. Companies at this stage may have relatively high dividend pay-outs because their growth prospects are fewer. These companies often offer stability in earnings and dividend growth.
Declining Stage
In this stage of the industrial life cycle - decline is indicated on either a relative or absolute basis. Clearly, investors should seek to spot industries in this stage and avoid them.
It is the second stage i.e. expansion, that is probably of most interest to investors. Industries that have survived the pioneering stage often offer good opportunities as the demand for their products and services is growing more rapidly than the economy as a whole. Growth is rapid, but orderly, an appealing characteristic to investors.
8. Support and Resistance
An important application of trend lines is in identification of support and resistance levels. Resistance is defined by Edward and Magee as Selling, actual or potential, sufficient in volume to satisfy all bids and hence stop prices from going higher for a time period. Support is defined as Buying, actual or potential, sufficient in volume to halt a downtrend in prices for an appreciable period.
A support zone is formed when the demand supply balance tilts in favor of buyers, resulting in a concentration of demand. A resistance zone similarly represents a concentration of supply. The concepts of support and resistance can be illustrated with the help of an example. Consider the following figure which shows the price chart.
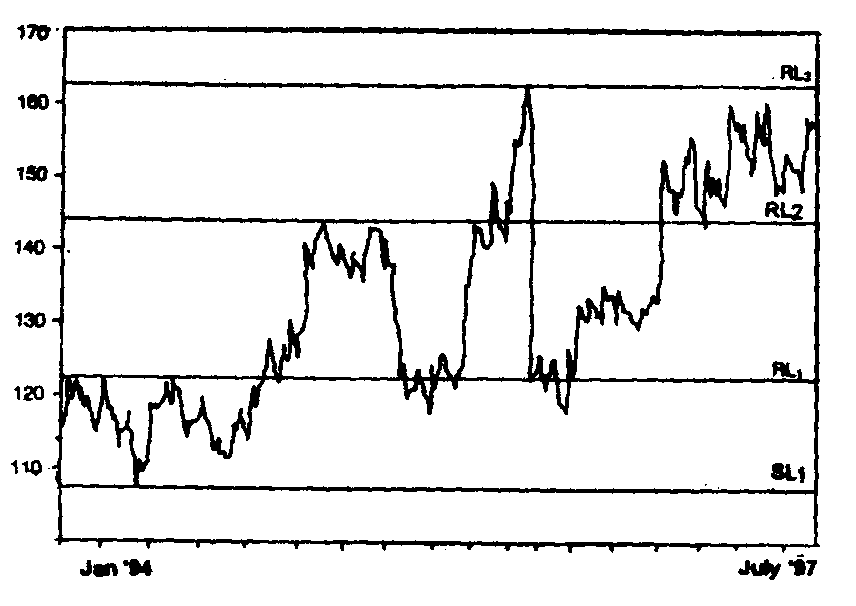
The behavior of prices during January-May does not throw up any price pattern, but the range within which the prices are found to be fluctuating warrants attention. On almost 6 occasions, prices have climbed to the level of Rs.122, and returned. Prices can be observed to face resistance at this level, as every time they reach there, they fail to climb further, but fall back. A trendline drawn to represent this level is called a resistance line (designated RL1 in the figure).
Similarly, prices have not fallen beyond a level of Rs.110, most of the times they returned from the resistance line. It can be said that a support level exists at which prices have shown a tendency to climb up again, rather than continue to fall. The maximum fall registered is at Rs.106, represents the level at which support has almost invariably occurred. Line SL1 represents this line
of support.
Support and resistance lines are, therefore, trend lines drawn to indicate the ranges a trend can be expected to take, using the past behavior as a reference point. These lines throw up further interesting inferences. When the prices pierce the resistance level RL1, it is an indication that
buyers have succeeded in breaking the resistance, and prices can be expected to climb up. The new high reached would represent a new level of resistance (represented as RL2). Prices now are
found to fluctuate between the old RL1, and the new RL2. The point to be noted is that the old
resistance line is the new support line, as price receive support at a level almost equal to RL1.
Similarly prices can be observed to reach a new resistance level RL3, and find support at the
previous RL2.
The support and resistance levels are important tools in confirming a reversal, in forecasting the course of prices, and in making appropriate price moves. The following principles are to be applied while using support and resistance lines for trend analysis:
i. Support and resistance lines are only approximations of the levels prices may be expected to obey. They should therefore be drawn using judgment, and clues from the past price behavior.
ii. Penetration of a support or resistance line, also confirmed by an underlying price pattern, is a fairly sure indication of a strong ensuing move in the same direction. New highs are reached after a resistance line is penetrated and new lows follow penetration of a support line.
iii. Prices are said to remain in a congestion zone as long as they fluctuate in narrow ranges within a support and resistance level. The direction of breakout from a congestion zone cannot be predicted in advance.
iv. The higher the volume accompanying the confirmation of a support or resistance level, the more its significance.
v. The speed and extent of the previous move determines the significance of a support or resistance level. Prices penetrate support (resistance) level generally after slowing down from a previous low (high) and hovering around a level for sometime.
vi. Support and resistance levels repeat their effectiveness time and again, even if separated by many years.
|
Attachment: |
| Earning: Approval pending. |