Cochin University of Science and Techology (CUST) 2005-5th Sem B.Tech Civil Engineering ,, Construction Networking Monitoring and Control - Question Paper
BTS(C) -V -05-064(F)
B. Tech Degree V Semester Examination, November 2005
CE 505 (B) CONSTRUCTION, NETWORKING MONITORING AND CONTROL
(2002 Admissions onwards)
 |
ime : 3 Hours (a) (b) |
Maximum Marks: 100
What is scheduling? Explain the different scheduling procedures used in construction. Explain Fulkersons rule for numbering events. Draw an arrow diagram showing the
| ||||||||||||||||||||||||||||||
|
(25) |
OR
(a) Explain the following terms and enumerate their uses :
II.
(i) Project break down (ii) Time and cost curve
(12)
(iii) Critical path method (iv) Listing of materials.
(b) Draw the network and find the critical path, completion time, EST, EFT, LST and LFT from the data given below :
Activities Duration (weeks')
1 -2 1-3
1-4
2-3
2-5
3-6
4-7
5-6
5-8
6-8
7-8
(13)
8-9
III. (a) Explain network compression.
(8)
(b) Find the optimum time and cost of the project whose details are given below
(17)
|
Normal |
Crash | |||
|
Activities |
Time |
Cost |
Time |
Cost |
|
(weeks) |
_(Rs.) |
(weeks) |
(Rs.) | |
|
1-2 |
4 |
1600 |
3 |
1800 |
|
1-3 |
7 |
2500 |
5 |
3000 |
|
1-4 |
6 |
2400 |
4 |
2800 |
|
2-5 |
7 |
1800 |
6 |
2000 |
|
3-5 |
6 |
1600 |
6 |
1600 |
|
4-5 |
8 |
3200 |
6 |
3800 |
|
5-6 |
9 |
2700 |
8 |
3000 - |
The indirect cost of the project is Rs. 2000/week.
OR
(a)
(b)
|
Normal |
Crash | |||
|
Activities |
Time |
Cost |
Time |
Cost |
|
(weeks) |
(Rs.) |
(weeks) |
(Rs.) | |
|
A-B |
3 |
1200 |
2 |
1600 |
|
A-C |
5 |
1800 |
3 |
2000 |
|
B-D |
2 |
1500 |
1 |
1800 |
|
C-D |
4 |
1000 |
2 |
1500 |
|
D-E |
5 |
1200 |
4 |
1300 |
(25)
Write notes on the following :
(i) Resources allocation (ii)
(iii) Scarce resources (iv)
(v) Scheduling for time limitations. (25)
OR
The data concerning manpower requirement for the various activities is given in the following table. Allocate manpower resources for the job and carry out resource leveling.
V.
Resources leveling Practical planning with CPM
VI.
Activity
1-2
2-3
2-4
2-5
3-9
4-6
4-9
5-7
6-8
7-10
8-9
9- 10
10- 11
Duration
2
4
4
3
4 7-2
5 2 5 2 3 5
No. of l abourers required 4 2 4 2 6 2 4 4 2 2 2 4 4
(25)
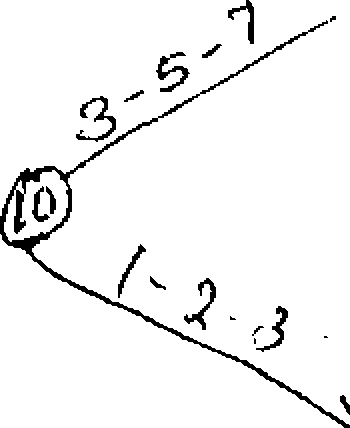
For the network shown in figure, determine the variance, time duration and standard deviation of all activities. Optimistic, most likely and pessimistic time estimates are given on the arrows representing the activities.
VII.
(25)
|
sr - 7- 7 | 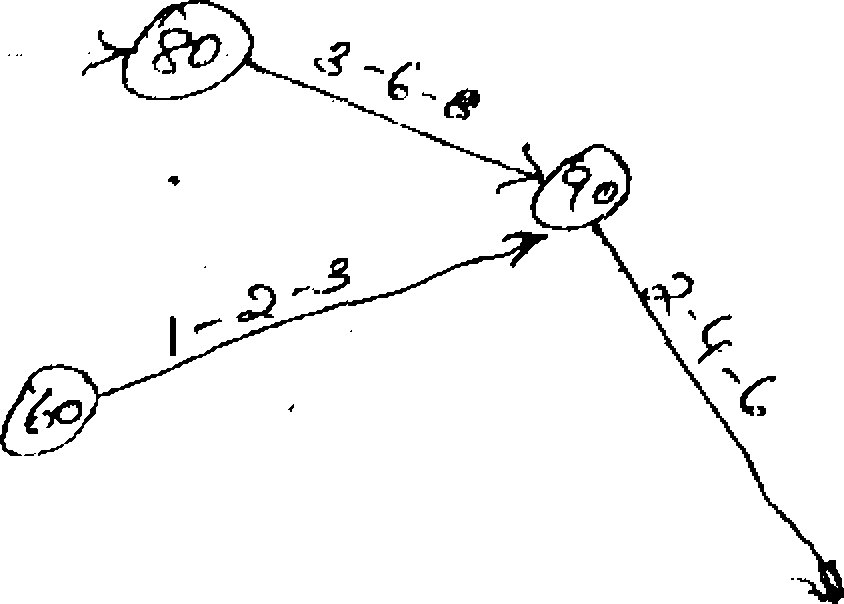 |
OR
Refer to the figure of Q. No. VII, determine the critical path and the probability of finishing the project within 36 days.
VIII.
***
(25)
|
Attachment: |
| Earning: Approval pending. |