Cochin University of Science and Techology (CUST) 2005-5th Sem B.Tech Civil Engineering ,, Construction Networking Monitoring and Control - Question Paper
BTS(C) - V - (S) - 05 - 042 (F)
B. Tech Degree V Semester (Special Supplementary) Examination, July 2005
CE 505 (B) CONSTRUCTION NETWORKING,
MONITORING AND CONTROL
(2002 Admissions)
Time : 3 Hours Maximum Marks : 100
(a)
(b)
Explain Fulkersons rule for node numbering. (10)
Draw the network for the following situation and number the events by Fulkersons rule:
A and B can be carried out at the same time C follows D F depends on E and D
(i) (ii) (iii)
(iv)
(v)
(vi)
(vii)
(viii)
(ix)
(x)
Neither I nor K can be started before B is completed but they can be concurrently performed.
C and E follow A E must be carried out before G J depends on the completion of I and K C and E can be executed at the same time H can be started when J, F and G are completed
H is the last activity.
(15)
OR
II.
(a)
(ii)
(iv)
Event
Float
(5)
(b)
Explain the terms :
(i) Activity (iii) Duration (v) Dummy.
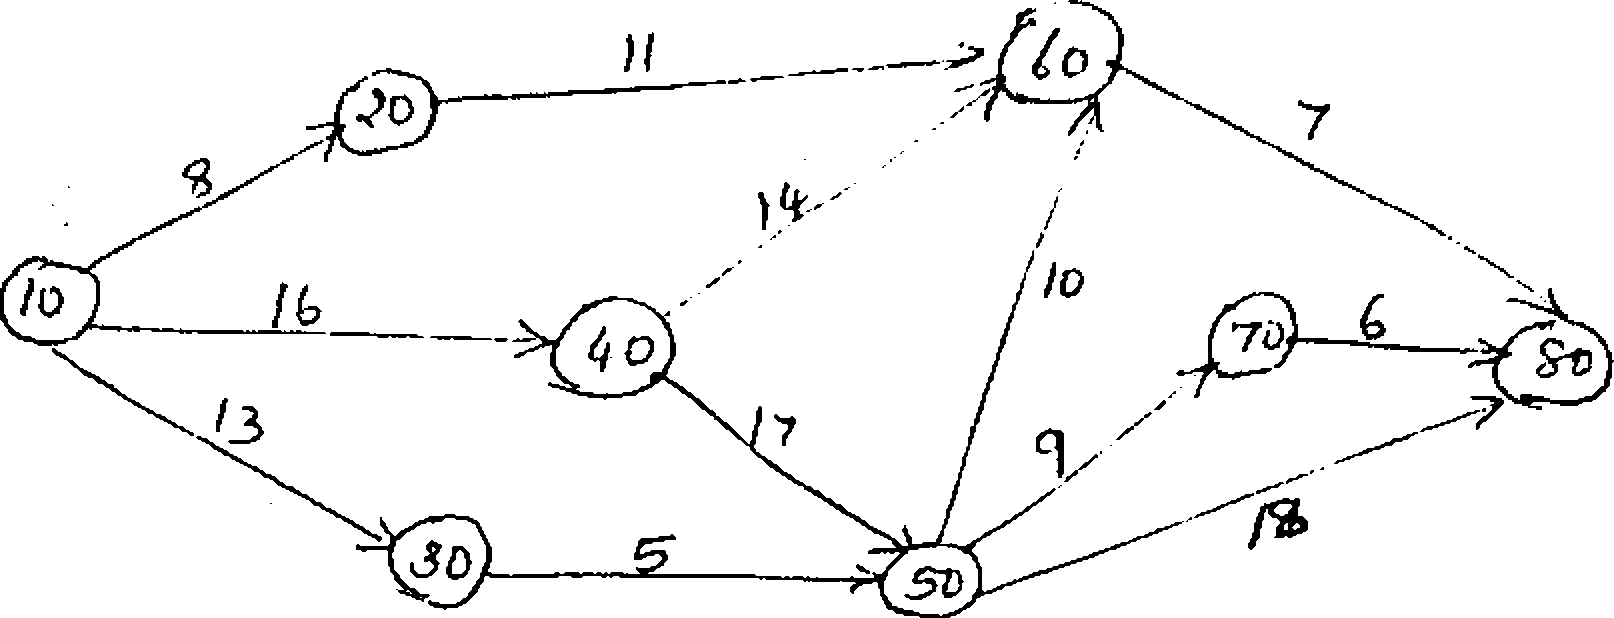
For the following CPM network:
(i) Calculate early start time, early finish time, latest start time, latest finish time and all floats of each activity.
(ii) Find critical path and project duration. (20)
III. (a) What is cost optimization? Explain the various steps in cost optimization. (8)
(b) The following data pertains to a project network. The indirect cost of the project is Rs. 2000/- per week. Determine the optimum cost and the optimum duration of the project. Also draw the least cost network.
|
Activity |
Normal duration (weeks) |
Normal cost (Rs.) |
Crash duration (weeks) |
Crash cost (Rs.) |
|
1-2 |
4 |
8000 |
2 |
12000 |
|
1-3 |
8 |
5000 |
6 |
8000 |
|
2-3 |
6 |
7000 |
4 |
9000 |
|
2-4 |
9 |
9000 |
7 |
12000 |
|
3-4 |
5 |
6000 |
3 |
9000 |
(17)
OR
IV. (a) Describe the following with points of difference :
(i) Direct cost and indirect cost
(ii) Normal time and crash time
(iii) All crash programme, normal programme and optimized crash programme. (6)
(b) For the utility data given below, determine the optimum project duration and cost:
| |||||||||||||||||||||||||||||||||||
|
Take indirect cost as Rs. 75/- per day. (19) |
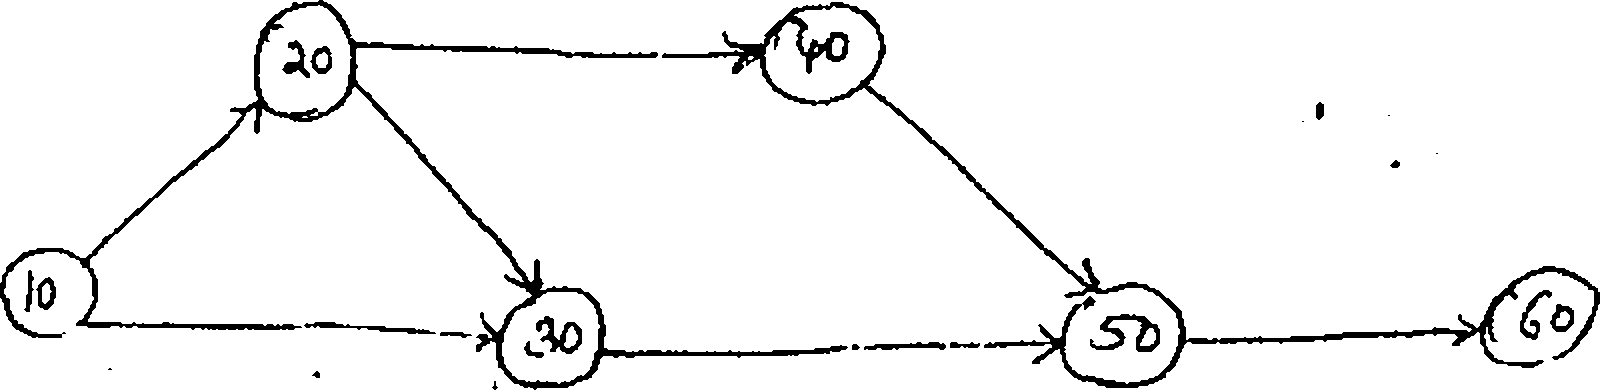
V. The network for a small job is shown in figure. Data regarding requirement of manpower
for the various activities is given in the following table. Carry out resource allocation/ eveling for the job.
|
Activity |
Duration |
Requirement per day | |
|
Carpenters (C) |
Labourers (L) | ||
|
10-20 |
2 |
2 |
2 |
|
10-30 |
4 |
- |
3 |
|
20-30 |
8 |
6 |
5 |
|
20-40 |
5 |
3 |
4 |
|
30-50 |
7 |
2 |
1 |
|
40-50 |
2 |
1 |
2 |
|
50-60 |
2 |
3 |
3 |
(25)
OR
What are the objectives of resource allocation? Explain resource levelling and
resource smoothing. (10)
Discuss in brief fee problem of resource allocation. How is this problem solved? (15)
For the various activities of a project, the optimistic time (to), the most likely time (ti.) and pessimistic time (tp) in days are as follows :
|
Activity |
to |
tL |
tp |
|
A-B |
2 |
6 |
10 |
|
A-C |
4 |
8 |
12 |
|
B-C |
2 |
4 |
6 |
|
C-D |
0 |
0 |
0 |
|
B-D |
2 |
3 |
4 |
|
C-E |
3 |
6 |
9 |
|
D-F |
6 |
10 |
14 |
|
E-F |
1 |
3 |
5 |
Draw the network and show on it the critical path. Calculate the probabilities of finishing the project in (i) 22 days and (ii) in 18 days. (25)
OR
The three time estimates to, and tp of each activity of a project are given below :
|
Activity |
to (days) |
tL (days) |
tp (days) |
|
1 -2 |
2 |
5 |
14 |
|
1-3 |
3 |
12 |
21 |
|
2-4 |
5 |
14 |
17 |
|
3-4 |
2 |
5 |
8 |
|
4-5 |
1 |
4 |
7 |
|
3-5 |
6 |
15 |
30 |
(i) Draw the network diagram
(ii) Find the expected duration and variance of each activity
(iii) Calculate early and late occurrences time for each event
(iv) Determine the expected project duration
(v) Find the variance and standard deviation of the entire project. (25)
|
Attachment: |
| Earning: Approval pending. |