Institute of Chartered Financial Analysts of India (ICFAI) University 2009 C.A Chartered Accountant Integrated Professional Competence (IPCC) - Financial management Revision Test s ( 09) - Question
Download the subsequent attachment:
PART II : FINANCIAL MANAGEMENT
1. Answer the following, supporting the same with reasoning/working notes:
(a) All of the following statements in regard to working capital are correct except
(i) Current liabilities are an important source of financing for many small firms.
(ii) Profitability varies inversely with liquidity.
(iii) The hedging approach to financing involves matching maturities of debt with specific financing needs.
(iv) Financing permanent inventory buildup with long-term debt is an example of an aggressive working capital policy.
(b) Royal Sporting Company has Rs. 50 lakhs in inventory and Rs. 20 lakhs in accounts receivable. Its average daily sales is Rs. 1,00,000. The company's payables deferral period is 30 days. You are required to calculate the length of the company's cash conversion period?
(c) Anand Toys maintains a separate account for cash disbursement. Total disbursements are Rs. 2,62,500 per month. Administrative and transaction cost of transferring cash to disbursement account is Rs. 25 per transfer. Marketable securities yield is 7.5% per annum. Determine the optimum cash balance according to William J Baumol model.
(d) Which of the following is an advantage of debt financing?
(i) Interest and principal obligations must be paid regardless of the economic position of the firm.
(ii) Debt agreements contain covenants.
(iii) The obligation is generally fixed in terms of interest and principal payments.
(iv) Excessive debt increases the risk of equity holders and therefore depresses share prices.
(e) Assume that a company is expected to pay a dividend of Rs. 5.00 per share this year. The company along with the dividend is expected to grow at a rate of 6%. If the current market price of the share is Rs. 60 per share, calculate the estimated cost of equity?
Working Capital Management
2. (a) The following information relates to material "A that is used by Gamma Company:
Annual usage in units 20,000
Working days per year 250
Safety stock in units 800
Normal lead time in working days 30
The units of the material "A will be required evenly throughout the year. Compute the order point.
(b) If Peta Company's terms of trade are 3/10, net 45 with a particular supplier, then calculate the cost on an annual basis of not taking the discount? Assume a 360-day year.
Investment Decisions
3. (a) Zion Limited is planning for the purchase of a machine that would cost Rs. 1,00,000
with the expectation that Rs. 20,000 per year could be saved in after-tax cash costs if the machine was acquired. The machine's estimated useful life is ten years, with no residual value, and would be depreciated by the straight-line method. You are required to calculate the payback period.
(b) Equipment A has a cost of Rs. 75,000 and net cash flow of Rs. 20,000 per year for six years. A substitute equipment B would cost Rs. 50,000 and generate net cash flow of Rs. 14,000 per year for six years. The required rate of return of both equipments is 11 per cent. Calculate the IRR and NPV for the equipments. Which equipment should be accepted and why?
Financing Decisions
|
4. Bestvision Company requires Rs. 10,00,000 of financing and is considering two options as given under: | ||||||||||||
|
In the first year of operations, the company is expected to have sales revenues of Rs.
5.00.000; cost of sales of Rs. 2,00,000; and general and administrative expenses of Rs.
1.00.000. The tax rate is 30%. All earnings are paid out as dividends at year end.
You are required to calculate:
(a) The weighted average cost of capital under option A, if the cost of equity is 12%.
(b) The return on equity and the debt ratio under the two options.
Financial Analysis and Planning
5. The following accounting information and financial ratios of Mahurat Limited relate to the year ended 31st December, 2008:
2008
I Accounting Information:
Gross Profit 15% of Sales
Net profit 8% of sales
Raw materials consumed 20% of works cost
Direct wages 10% of works cost
Stock of raw materials 3 months' usage
Stock of finished goods 6% of works cost
Debt collection period 60 days All sales are on credit
II Financial Ratios:
Fixed assets to sales 1 : 3
Fixed assets to Current assets 13 : 11
Current ratio 2 : 1
Long-term loans to Current liabilities 2 : 1
Capital to Reserves and Surplus 1 : 4
If value of fixed assets as on 31st December, 2007 amounted to Rs. 26 lakhs, you are required to prepare a summarised Profit and Loss Account of the company for the year ended 31st December, 2008 and also the Balance Sheet as on 31st December, 2008.
6. Zubair Electronics is considering the proposal of taking up a new project which requires an investment of Rs. 400 lakhs on machinery and other assets. The project is expected to yield the following earnings (before depreciation and taxes) over the next five years:
Year Earnings (Rs. in lakhs)
1 160
2 160
3 180
4 180
5 150
The cost of raising the additional capital is 12% and assets have to be depreciated at 20% on Written Down Value' basis. The scrap value at the end of the five years' period may be taken as zero. Income-tax applicable to the company is 50%.
You are required to calculate the net present value of the project and advise the management to take appropriate decision. Also calculate the Internal Rate of Return of the Project.
Note: Present value of Re. 1 at different rates of interest is as follows:
|
Year |
10% |
12% |
14% |
16% |
|
1 |
0.91 |
0.89 |
0.88 |
0.86 |
|
2 |
0.83 |
0.80 |
0.77 |
0.74 |
|
3 |
0.75 |
0.71 |
0.67 |
0.64 |
Financing Decisions
4 0.68 0.64 0.59 0.55
5 0.62 0.57 0.52 0.48
7. Vishwabharati Limited has the following book value capital structure: Equity Capital (in shares of Rs. 10 each, fully paid up - at par)
Rs. 15 crores Rs. 1 crore Rs. 20 crores Rs. 10 crores Rs. 12.5 crores
11% Preference Capital (in shares of Rs. 100 each, fully paid up - at par)
Retained Earnings
13.5% Debentures (of Rs. 100 each)
15% Term Loans
The next expected dividend on equity shares per share is Rs. 3.60; the dividend per share is expected to grow at the rate of 7%. The market price per share is Rs. 40. Preference share, redeemable after ten years, is currently selling at Rs. 75 per share. Debentures, redeemable after six years, are selling at Rs. 80 per debenture. The Income tax rate for the company is 40%.
You are required to calculate the weighted average cost of capital using:
(a) Book value proportions; and
(b) Market value proportions.
Financial Analysis and Planning
Housestores Limited Consolidated Balance Sheets
8.
February 2, 2009
Rs.
February 2, 2008
Rs.
2,188
65
1,072
8,338
2,477
69
Amounts in lakhs, except per share data Assets
Current Assets:
Cash and Cash equivalents
Short-term investments, including current maturities of long-term investments
Receivables, net
Merchandise inventories
Other current assets 254
Total current assets 11,917 Property and equipment, at cost:
Land 5,560
83
419
156
26,394
3,436
Furniture, fixtures and equipment 4,074
Leasehold improvements 872
Construction in progress 724
Capital leases 306
20,733
Less: Accumulated depreciation and amortization 3,565
Net property and equipment 17,168
Notes receivable 107
Cost in excess of the fair value of net assets
acquired, net of accumulated amortisation of Rs. 575
50 at February 2, 2009, and Rs. 49 at February 3, 575
2008
Other assets 244
Total assets 30,011 Liabilities and Shareholders Equity
Current Liabilities:
Accounts payable 4,560
Accrued salaries and related expenses 809
Sales taxes payable 307
Deferred revenue 998
Income taxes payable 227
Other accrued expenses 1,134
Total current liabilities 8,035
Long-term debt, excluding current installments 1,321
Other long-term liabilities 491
Deferred income taxes 362
Total liabilities 10,209 8,312
Shareholders Equity
Equity shares, par value Rs. 0.05; authorized:
10,000 shares, issued and outstanding 2,362 shares at February 3, 2009, and 2,346 shares at
| ||||||||||||||||||||||||||||||||||||||||||||||||||||||||||||||||||||||||||||||||
|
Interest income (expense): Interest and investment income 79 53 47 | ||||||||||||||||||||||||||||||||||||||||||||||||||||||||||||||||||||||||||||||||
|
Interest expense |
(371 |
(28) |
(2H |
|
Interest, net |
42 |
25 |
26 |
|
Earnings before provision for income taxes |
5,872 |
4,957 |
4,217 |
|
Provision for income taxes |
2,208 |
1,913 |
1,636 |
|
Net earnings |
Rs. 3,664 |
Rs. 3,044 |
Rs. 2,581 |
|
Weighted-average equity shares |
2,336 |
2,335 |
2,315 |
|
Basic earnings per share |
Rs. 1.57 |
Rs. 1.30 |
Rs. 1.11 |
|
Diluted weighted-average equity shares |
2,344 |
2,353 |
2,352 |
|
Diluted earnings per share |
Rs. 1.56 |
Rs. 1.29 |
Rs. 1.10 |
You are required to calculate:
(a) Profitability Ratios
(b) Activity Ratios
(c) Liquidity Ratios
(d) Debt Utilisation Ratios
(e) Market Ratios.
Financial Analysis and Planning
9. The following financial statements relate to Thermox Limited:
Balance Sheet as on
|
March 31, 2009 |
March 31, 2008 | |
|
Capital and Liabilities: |
Rs. |
Rs. |
|
Share capital, Rs. 10 par value |
1,67,500 |
1,50,000 |
|
Share premium |
3,35,000 |
2,37,500 |
|
Reserves and Surplus |
1,74,300 |
1,23,250 |
|
Debentures |
2,40,000 |
- |
|
Long-term loans |
40,000 |
50,000 |
|
Creditors |
28,800 |
27,100 |
|
Bank Overdraft |
7,500 |
6,250 |
|
Accrued expenses |
4,350 |
4,600 |
|
Income-tax payable |
48,250 |
16,850 |
|
10,45,700 |
6,15,550 |
|
March 31, 2009 |
March 31, 2008 | |
|
Assets: |
Rs. |
Rs. |
|
Land |
3,600 |
3,600 |
|
Building, net of depreciation |
6,01,800 |
1,78,400 |
|
Machinery, net of depreciation |
1,10,850 |
1,07,050 |
|
Investment in A' Ltd. |
75,000 |
- |
|
Stock |
58,800 |
46,150 |
|
Prepaid expenses |
1,900 |
2,300 |
|
Debtors |
76,350 |
77,150 |
|
Trade Investments |
40,000 |
1,05,000 |
|
Cash |
77,400 |
95,900 |
|
10,45,700 |
6,15,550 |
Income Statement for the year ended March 31, 2009
Rs.
13,50,000
Net Sales
Less: Cost of goods sold and operating expenses (including depreciation on
buildings of Rs. 6,600 and depreciation on machinery of Rs. 11,400) 12,58,950
Net operating profit 91,050
Gain on sale of trade investments 6,400
Gain on sale of machinery 1,850
Profits before tax 99,300
Income-tax 48,250
Profits after tax 51,050
Additional information:
(i) Machinery with a net book value of Rs. 9,150 was sold during the year.
(ii) The shares of A' Ltd. were acquired by issue of debentures.
You are required to prepare a Funds Flow Statement (Statement of Changes in Financial Position on Working capital basis) for the year ended March 31, 2009.
Time Value of Money
10. (a) Mr. Pinto borrowed Rs. 1,00,000 from a bank on a one-year 8% term loan, with interest compounded quarterly. Determine the effective annual interest on the loan?
(b) Suppose Adit has borrowed a 3-year loan of Rs. 10,000 at 9 per cent from his employer to buy a motorcycle. If his employer requires three equal end-of-year repayments, then calculate the annual instalment.
Working Capital Management
11. (a) Konika Electronics has total sales of Rs. 3.2 crores and its average collection period is 90 days. The past experience indicates that bad-debt losses are 1.5% on sales. The expenditure incurred by the company in administering its receivable collection efforts are Rs. 5,00,000. A factor is prepared to buy the company's receivables by charging 2% commission. The factor will pay advance on receivables to Konika Electronics at an interest rate of 18% p.a. after withholding 10% as reserve. You are required to compute the effective cost of factoring to Konika Electronics.
(b) Vijaylaxmi Limited, a newly formed company, has applied to a commercial bank for the first time for financing its working capital requirements. The following information is available about the projections for the current year:
Estimated level of activity: 1,04,000 completed units of production plus 4,000 units of work-in-progress. Based on the above activity, estimated cost per unit is:
Raw material Rs. 80 per unit
Direct wages Rs. 30 per unit
Overheads (exclusive of depreciation) Rs. 60 per unit
Total cost Rs. 170 per unit
Selling price Rs. 200 per unit
Raw materials in stock: Average 4 weeks consumption, work-in-progress (assume 50% completion stage in respect of conversion cost) (materials issued at the start of the processing).
Finished goods in stock 8,000 units
Credit allowed by suppliers Average 4 weeks
Credit allowed to debtors/receivables Average 8 weeks
Lag in payment of wages 1
Average 1 weeks
Cash at banks (for smooth operation) is expected to be Rs. 25,000.
Assume that production is carried on evenly throughout the year (52 weeks) and wages and overheads accrue similarly. All sales are on credit basis only.
You are required to determine:
(i) The net working capital required;
(ii) The maximum permissible bank finance under first and second methods of financing as per Tandon Committee Norms.
12. Differentiate between the following:
(a) Traditional Phase and Modern Phase of Financial Management
(b) Liquidity Ratios and Activity Ratios
(c) Debt Financing and Equity Financing
(d) Financial Lease and Operating Lease.
13. Write short notes on the following:
(a) Role of Chief Financial Officer (CFO)
(b) Composition of ROE using Du Pont
(c) Trading on Equity
(d) External Commercial Borrowings (ECBs).
SUGGESTED ANSWERS/HINTS
1. (a) The requirement is to determine the false statement regarding working capital management. Answer (iv) is correct because financing permanent inventory buildup with long-term debt is an example of a conservative working capital policy. Answers (i), (ii), and (iii) are all accurate statements about working capital management.
(b) Calculation of the Conversion Cycle
Cash Conversion Period = Inventory Conversion Period + Receivables Collection Period - Payable Deferral Period
Inventory Conversion Period = Rs. 50,00,000/Rs. 100,000 = 50 days Receivable Conversion Period = Rs. 20,00,000 / Rs. 100,000 = 20 days.
Therefore, Cash Conversion Cycle = 50 days + 20 days - 30 days = 40 days
(c) Determination of Optimal Cash Balance according to William J. Baumol Model
The formula for determining optimum cash balance is:
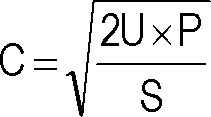
Where,
C = Optimum cash balance
U = Annual (or monthly) cash disbursement
P = Fixed cost per transaction.
S = Opportunity cost of one rupee p.a. (or p.m.)
15,75,00,000
0.075 = 2,10,00,00,000 Optimum cash balance, C, = Rs. 45,826
(d) The requirement is to identify the advantages of debt financing. Answer (iii) is correct because the fixed obligation of interest and principal is an advantage to debt financing. Answers (i), (ii), and (iv) are incorrect because they are all disadvantages of debt financing.
(e) Calculation of Estimated Cost of Equity using Dividend-yield-plus-growth-rate Approach
Estimated cost of equity = ( Dividend / Price of the Share) + Growth rate = [(Rs. 5 -Rs. 60) + 6%]
= 14.3%
2. (a) Determination of Order Point for Material A
When safety stock is maintained, the order point is computed as follows:
Order Point = Daily demand x Lead time in days + Safety stock Daily demand = 20,000 units - 250 days = 80 units Order Point = [(80 x 30) + 800]
= 3,200 units
(b) Calculation of Cost of Not taking a Trade Discount
The formula for computing the interest is as under :
Discount percent 360 days
Interest =
100% - Discount percent Total pay period - Discount period 3% 360 days
= 31.81%
100% - 3% 45 days -10 days
Cost of Not taking a Trade Discount = 31.81%
3. (a) Calculation of Payback Period
The payback method evaluates investments on the length of time until total amount invested are recouped in the form of cash inflows or cash outflows avoided.
Payback Period = Initial investment - Annual cash inflow of a project
= 5 years.
(b) Calculation of Net Present Value (NPV) and Internal Rate of Return (IRR) for Equipment A and Equipment B
Equipment A:
NPV = 20,000 x PVAF6,0.11 - 75,000 = 20,000 x 4.231 - 75,000 = 84,620 - 75,000 = Rs. 9,620 IRR = 20,000 x PVAF6,r= 75,000 PVAF6,r= 75,000 / 20,000 = 3.75 From the present value of an annuity table, we find:
PVAF6,0.15= 3.784 PVAF6 0.16= 3.685
3.784 - 3.75 '
3.784 - 3.685
Therefore, IRR = r = 0.15 + 0.01
= 0.15 + 0.0034 = 0.1534 or 15.34%.
Equipment B:
NPV = 14,000 x PVAF6,0.11 - 50,000 = 14,000 x 4.231 - 50,000 = 59,234 - 50,000 = Rs. 9,234 IRR = 14,000 x PVAF6,r = 50,000 PVAF6,r = 50,000/14,000 = 3.571 From the present value of an annuity table, we find: PVAF6,0.17 = 3.589 PVAF6 0.18 = 3.498
3.589 - 3.571
3.589 - 3.498
Therefore, IRR = r = 0.17 + 0.01
= 0.17 + 0.002 = 0.172 or 17.20%.
Recommendation: Equipment A has a higher NPV but lower IRR as compared to Equipment B. Therefore, Equipment A should be preferred since the wealth of the shareholders will be maximized.
4. (a) Calculation of Weighted Average Cost of Capital (WACC)
WACC = (Weight of equity) x (Cost of equity) + (Weight of debt) x (Before-tax cost of debt) x (1 - Tax rate)
= (0.7) x (0.12) + (0.3) x (0.08) x (1-0.3)
= 0.084 + 0.0168 = 0.1008 = 10.08%.
(b) Calculation of Return on Equity (ROE) and Debt Ratio
Return on Equity = Net Income + Amount of Equity Invested
Debt Ratio = Amount of Debt Financing + Total Assets
|
Calculations of the Two Ratios for Both Financing Arrangements | |||||||||||||||||||||||||||||||||||||||||||||
|
(i) Calculation of Sales Fixed Assets _ 1 Sales 3
_ - Sales _ Rs.78,00,000 Sales 3
(ii) Calculation of Current Assets
Fixed Assets _ 13 Current Assets 11
Current Assets 11
(iii) Calculation of Raw Material Consumption and Direct Wages
Rs.
Raw Material Consumption (20% of Works Cost) Rs. 13,26,000
Direct Wages (10% of Works Cost) Rs. 6,63,000
(iv) Calculation of Stock of Raw Materials (= 3 months usage)
3
= 13,26,000 x _ Rs.3,31,500 12
(v) Calculation of Stock of Finished Goods (= 6% of Works Cost)
= 66,30,000 x _ Rs.3,97,800 100
(vi) Calculation of Current Liabilities
Current Assets
_ 2
Current Liabilities 22,00,000
_ 2 Current Liabilities _ Rs. 11,00,000
Current Liabilities
(vii) Calculation of Debtors
Average Collection Period = Debtors x 365
Credit Sales
Debtors - x 365 _ 60 Debtors _ Rs. 12,82,191.78or Rs. 12,82,192
78,00,000
(viii) Calculation of Long term Loan LongtermLoan _ 2 CurrentLiabilities 1
Longtermloan = 2 Long term loan = Rs. 22,00,000.
11,00,000 1
(ix) Calculation of Cash Balance
Rs.
22,00,000
20,11,492
1,88,508
26,00,000
48,00,000
33.00.000
15.00.000
Current Assets
Less: Debtors 12,82,192
Raw materials stock 3,31,500 Finished goods stock 3,97,800 Cash balance
(x) Calculation of Net worth
Fixed Assets Current Assets Total Assets
Less: Long term Loan 22,00,000
Current Liabilities 11,00,000
Net worth
Net worth = Share capital + Reserves = 15,00,000
-Capta-= - Share Capital = 15,00,000 x - = Rs. 3,00,000
ReservesandSurplus 4 5
4
Reserves and Surplus = 15,00,000 x = Rs.12,00,000
5
Profit and Loss Account of Mahurat Limited for the year ended 31st December, 2008
Particulars By Sales
Rs.
13.26.000 6,63,000
46.41.000
Rs.
78,00,000
Particulars To Direct Materials To Direct Wages To Works (Overhead) Balancing figure
|
To Gross Profit c/d (15% of Sales) 11,70,000 78,00,000 5,46,000 78,00,000 11,70,000 To Selling and Distribution Expenses (Balancing figure) |
By Gross Profit b/d |
To Net Profit (8% of Sales)
|
Liabilities Share Capital Reserves and Surplus Long term loans Current liabilities Rs. 3,00,000 12,00,000 22,00,000 11,00,000 Stock of Raw 3,31,500 Material Stock of Finished Goods 48,00,000 |
Assets Fixed Assets Current Assets: Debtors 3,97,800 12,82,192 1,88,508 48,00,000 Cash |
6. (i) Calculation of Net Cash Flow
|
(Rs. in lakhs) | ||||||||||||||||||||||||||||||||||||||||||
|
*including depreciation and loss on disposal of assets. Calculation of Net Present Value (NPV)
|
(Rs. in lakhs) | ||||||||||||||||||||||||||||||||||||||||||||||||||||||||||||||||
|
Less: Initial Investment 400.00 NPV 38.62
(iii) Advise: Since Net Present Value of the project is maximum at 12% therefore the project should be implemented.
(iv) Calculation of Internal Rate of Return (IRR)
IRR = 14% + 16.072%
16.07 - (-3.86)
14% 32.14
= 14% +-
19.93
= 14% + 1.61% = 15.61%.
|
Weighted Average Cost of Capital (b) Statement showing Computation of Weighted Average Cost using Market Value Proportions | ||||||||||||||||||||||||
|
|
7. (a) Statement showing Computation of Weighted Average Cost of Capital by using Book Value Proportions | ||||||||||||||||||||||||||||||||||||||||||||||||||||||
| ||||||||||||||||||||||||||||||||||||||||||||||||||||||
|
13.93% of Capital by |
Weighted Average Cost of Capital Note: Since retained earnings are treated as equity capital for purposes of calculation of cost of specific source of finance, the market value of the ordinary shares may be taken to represent the combined market value of equity shares and retained earnings. The separate market values of retained earnings and ordinary shares may also be worked out by allocating to each of these a percentage of total market value equal to their percentage share of the total based on book value.
Working Notes:
1. Cost of Equity Capital and Retained Earnings (Ke)
Ke = D + g P0
Where,
Ke = Cost of equity capital D1 = Expected dividend at the end of year 1 P0 = Current market price of equity share g = Growth rate of dividend Now, it is given that D1 = Rs. 3.60, P0= Rs. 40 and g= 7%
Rs. 3.60
| ||||||||||||||||||||||||||||||||
|
14.59% |
Therefore,
|
p |
| ||||||||||||
Where,
D = Preference dividend
Ke
+ 0.07
Rs. 40 or Ke = 16%
2. Cost of Preference Capital (Kp)
K
F = Face value of preference shares P = Current market price of preference shares N = Redemption period of preference shares Now, it is given that D= 11%, F=Rs. 100, P= Rs. 75 and n= 10 years
"Rs.100-Rs.75'
11 +
10
x100
Therefore
Kp
Rs.100 + Rs.75 2
= 15.43 %
3. Cost of Debentures (K)
|
Kd = |
| ||||||||
= Rate of interest
Where,
r
t
F
P
n
= Tax rate applicable to the company = Face value of debentures = Current market price of debentures = Redemption period of debentures
Now it is given that r= 13.5%, t=40%, F=Rs. 100, P=Rs. 80 and n=6 years
Therefore,
|
Kd = |
|
x100 | ||||||||
= 12.70% Cost of Term Loans (Kt)
4
Kt = r (1 -1)
Where,
r
t
Now, r
= Rate of interest on term loans = Tax rate applicable to the company = 15% and t= 40%
Profitability ratios measure how effective a firm is at generating profit from operations. They are some of the most closely watched and widely quoted financial ratios. Management attempts to maximize these ratios to maximize firm value.
(i) Gross margin measures the percentage of each sale in rupees remaining after payment for the goods sold.
G i Grossprofit Rs.18,108 Q1 090/
Gross margin =-- =-1 = 31.09%.
Net sales Rs.58,247
Remember that gross profit is equal to net sales minus cost of goods sold.
(ii) Profit margin finds the proportion of revenue that finds its way into profits. Profit margin is calculated as net income divided by net sales, as shown below:
Net income after interest and taxes Rs.3,664
Profit margin =-=-1-= 6.29%.
Net sales Rs.58,247
(iii) Operating profit margin measures the percentage of each sales in rupees that remains after the payment of all costs and expenses except for interest and taxes. This ratio is followed closely by analysts because it focuses on operating results. Operating profit is often referred to as earnings before interest and taxes or EBIT.
Operatingprofit Rs.5,830
Operating profit margin = - =-1-= 10.01%.
Net sales Rs.58,247
(iv) Return on assets (return on investment) measures the percentage return generated on the assets available (investment). This ratio may be calculated as:
, Net income after interest and taxes Rs. 3,664 .
Return on assets =-=-1-= 12.99%.
Average total assets Rs. 28,203
(Ending total assets + Beginning total assets) 2
Average total assets =
(Rs. 30,011 + Rs.26,394)
2
= Rs. 28,203.
(v) Return on equity measures the percentage return generated to equity shareholders.
Net income after interest and taxes Rs.3,664
Return on equity =-=-1-= 19.34%.
Average shareholders' equity Rs.18,942
Average shareholders' equity (SE) = (EndingSE + Beginning SE)
_ (Rs. 19,802 + Rs.18,082)
_ 2 = Rs. 18,942.
(vi) The dividend payout ratio measures the dividend paid in relation to net earnings. If Housestores Limited's dividend for the year was Rs. 0.22, the dividend payout is calculated as:
, r Cashdividendper share
Dividend payout ratio _---
Earnings per share
Rs.0.22 _ Rs. 1.57 = 0.14 or 14%.
(b) Asset Utilisation (Activity) Ratios
Asset utilization ratios measure the time it takes to convert various assets to sales or cash. Asset utilisation ratios are used to measure the efficiency with which assets are managed. For this reason, they are often called asset management ratios.
(i) Receivables turnover measures the number of times per year the balance of receivables is collected. This is a very important measure of the efficiency with which management is managing accounts receivables.
Net credit sales
Receivables turnover _-
Average accounts receivable
This ratio cannot be computed for Housestores Limited since the company does not break out the amount of credit sales.
(ii) The average collection period measures the average number of days it takes to collect an account receivable. This ratio is also referred to as the number of days of receivable and the number of day's sales in receivables.
,, . , Average accountsreceivable
Average collection period _---
Average sales per day
Again, this ratio cannot be calculated for Housestores Limited because the company does not break out the amount of credit sales.
(iii) Inventory turnover measures the efficiency with which a firm utilizes (manages) its inventory.
. , , Cost of goods sold Rs.40,139
Inventory turnover _---_-_ 5.33 times
Average inventory Rs.7,532
(Ending inventory + Beginning inventory) Average inventory _ ---- 2--
_ (Rs.8,338 + Rs. 6,725)
_ 2
= Rs. 7,532.
(iv) A related measure is the number of days sales in inventory.
Average inventory Cost of goods sold / 365
Number of days'sales in inventory _
Rs.7,532
Rs. 40,139 /365 = 68.49 days.
(v) Fixed asset turnover measures the efficiency with which the firm uses its fixed assets.
Sales Rs. 58,247
Fixed asset turnover _-_-1 _ 3.58 times
Average net fixed assets Rs. 16,272
, (Endingfixed assets + Beginningfixed assets)
Average fixed assets _ --------
_ (Rs. 17,168 + Rs. 15,375)
_ 2 = Rs. 16,272.
(vi) Total asset turnover measures the efficiency with which the firm uses its total assets.
T Sales Rs. 58,247 2 07
Total asset turnover _-_-_ 2.07 times
Average total assets Rs. 28,203
Liquidity ratios measure the firm's ability to meet its short-term obligations as they come due.
(i) The current ratio is the most common measure of short-term liquidity. It is sometimes referred to as the working capital ratio because net working capital is the difference between current assets and current liabilities.
, Current assets Rs. 11,917 .
Current ratio _-_-1 _ 1.48
Current liabilities Rs.8,035
Where,
Current assets include cash and cash equivalents, net accounts receivable, marketable securities classified as current, inventories and prepaid expenses.
Current liabilities include accounts payable, short-term notes payable, current maturities of long-term debt, unearned revenue, and other accrued liabilities.
(ii) The quick (acid) ratio provides a more conservative measure of short-term liquidity. It takes out inventory because in times of financial difficulty inventory may be saleable only at liquidation value.
Current assets - Inventory Rs. 11,917 - 8,338
Quick ratio =-- =-!-1 = 0.45
Current liabilities Rs.8,035
Debt utilisation ratios measure the effectiveness with which management finances
the assets of the firm. They are used to evaluate the financial leverage of the firm.
(i) The debt to total assets measures the proportion of total assets financed with debt and, therefore, the extent of financial leverage.
, , Totalliabilities Rs.10,209 Q,00%
Debt to total assets =-=-1 = 34.02%
Totalassets Rs. 30,011
(ii) The debt to equity ratios also measures the extent of the firms financial leverage.
Totalliabilities Rs.10,209 515C0/
Debt to equity ratio =-=-1 = 51.56%
Totalequity Rs.19,802
(iii) The times interest earned measures the firms ability to make contractual interest payments.
. , , Earningsbefore interest and taxes Rs.5,830
Times interest earned =---=-= 157.57
Interest expense Rs.37
Market ratios involve measures that consider the market value of the company's
shares.
(i) The price/earnings (PE) ratio is the most commonly quoted market measure. Assuming that Housestores Limited's share price is Rs. 34.00, the price/earnings ratio would be computed as follows:
, Market price per share Rs.34
Price / earnings =-----=-= 21.66
Earnings per share Rs.1.57
(ii) The market / book ratio provides another evaluation of how investors view the company's past and future performance. To calculate the ratio, the book value per share must first be calculated.
Number of shares outstanding Rs.19,802
- = Rs.8.38 per share
2,362
Again, assuming a Rs. 34 market price per share, the market / book ratio is calculated as follows:
Market value per share Book value per share
Rs. 34.00 = 4.06.
Market / Book ratio =
Rs.8.38
Schedule of Changes in Working Capital
9.
March 31, March 31, 2008 Impact on Working Capital
2009
58,800
1,900
76,350
40,000
77,400
Increase
Decrease
46.150 2,300
77.150 1,05,000
95,900
12,650
400
800
65,000
18,500
84,700
1,700
1,250
31,400
34,350
2,54,450
3,26,500
12,650
28,800
7,500
4,350
48,250
88,900
27,100
6,250
4,600
16,850
54,800
250
250
Current Assets Stock
Prepaid expenses Debtors
Trade Investments Cash
Current Liabilities Creditors Bank overdraft Accrued expenses Income tax payable
|
Net Working Capital 1,65,550 1,06,150 2,71,700 Decrease in net working capital |
2,71,700 12,900 1,19,050 _- 1,06,150 2,71,700 1,19,050 |
Machinery Account
Rs. Rs.
Balance b/d 1,07,050 Sale of machinery (given) 9,150
Purchase of machinery (plug) 24,350 Depreciation (given) 11,400
_ Balance c/d 1,10,850
1,31,400 1,31,400
Trade Investments Account
Rs. Rs.
Balance b/d 1,05,000 Cash (sale of trade investments) 65,000
_ Balance c/d 40,000
1,05,000 1,05,000
Estimation of Funds flow from Operations
Rs.
Profit after tax 51,050
Add: Depreciation on Buildings 6,600
Depreciation on Machinery 11,400 18,000
69,050
Less: Gain on sale of machinery 1,850
Funds from Operations 67,200
Note: Gain on sale of trade investment has been considered as an operating income. Trade investments have been considered as part of current assets.
Statement of Changes in Financial Position (Working Capital basis)
for the year ended March 31, 2009
Rs.
Sources:
Funds from operations 67,200
Sale of machinery on gain (9,150 + 1,850) 11,000
Debentures issued (Rs. 2,40,000 - 75,000) 1,65,000 Investment in A' Ltd. financial transaction and hence not affecting working capital
Issue of share capital (including share premium) 1,15,000
Financial Resources Provided 3,58,200 Uses:
Purchase of building (6,01,800 + 6,600 - 1,78,400) 4,30,000
Purchase of machinery 24,350
Payment of long-term loan 10,000
Financial Resources Applied 4,64,350
Net Decrease in Working Capital 1,06,150
10. (a) Calculation of Effective Annual Interest Rate
Effective Interest Rate (EAR) is calculated as follows:
ear = +mj -1
Where,
r = Stated interest rate m = Compounding frequency
EAR = 1 + -1
= 1.0824- 1 = 0.0824 = 8.24%
Effective Annual Interest Rate = 8.24%.
(b) Calculation of Annual Installment
10.000 = A X PVFA3,0.09
10.000 = A x 2.531
A = 10,000 = Rs. 3,951
2.531
By paying Rs. 3,951 each year for three years, Adit shall completely pay-off his loan with 9 per cent interest. This can be observed from the loan-amortisation schedule given under:
Loan Amortisation Schedule
| |||||||||||||||||||||||||
|
*Rounding off error. |
He pays Rs. 3,951 at the end of each year. At the end of the first year, Rs. 900 of this amount is interest (Rs. 10,000 x 0.09), and the remaining amount (Rs. 3,051) is applied towards the repayment of principal. The balance of loan at the beginning of the second year is Rs. 6,949 (Rs. 10,000 - Rs. 3,051). As for the first year, calculations for interest and principal repayment can be made for the second and third years. At the end of the third year, the loan is completely paid-off.
11. (a) Computation of Effective Cost of Factoring to Konika Electronics
Average level of Receivables = 3,20,00,000 x 90/360 80,00,000
Factoring commission = 80,00,000 x 2/100 1,60,000
Factoring reserve = 80,00,000 x 10/100 8,00,000
Amount available for advance
= Rs. 80,00,000 - (1,60,000+8,00,000) 70,40,000
Factor will deduct his interest @ 18% :-
l4 4 Rs.70,40,000 x18 x 90 Rs. 3,16,800
Interest =-11-
100 x 360
Advance to be paid = Rs. 70,40,000 - Rs. 3,16,800 = Rs. 67,23,200
Annual Cost of Factoring to Konika Electronics: Rs.
Factoring commission (Rs. 1,60,000 x 360/90) 6,40,000
Interest charges (Rs. 3,16,800 x 360/90) 12,67,200
Total 19,07,200
Konika Electronicss Savings on taking Factoring Service: Rs.
Cost of credit administration saved 5,00,000
Cost of Bad Debts (Rs. 3,20,00,000 x 1.5/100) avoided 4,80,000
Total 9,80,000
Net Cost to Konika Electronics (Rs. 19,07,200 - Rs. 9,80,000) 9,27,200
Rs.9,27,200 x 100
Effective rate of interest to Konika =
320 1379%
6,64,615
5,00,000
13,60,000
29,53,846
A. Current Assets:
Raw material stock (Refer to Working note 3) Work in progress stock (Refer to Working note 2) Finished goods stock (Refer to Working note 4) Debtors
(Refer to Working note 5) Cash and Bank balance
B. Current Liabilities:
Creditors for raw materials (Refer to Working note 6) Creditors for wages (Refer to Working note 7) Net Working Capital (A-B)
91,731
46,95,990
The Maximum Permissible Bank Finance as per Tandon Committee Norms
First Method:
75% of the net working capital financed by bank i.e. 75% of Rs. 46,95,990 (Refer to (i) above)
= Rs. 35,21,993 Second Method:
(75% of Current Assets)- Current liabilities (i.e. 75% of Rs. 55,03,461)-Rs. 8,07,471 (Refer to (i) above)
= Rs. 41,27,596 - Rs. 8,07,471 = Rs. 33,20,125 Working Notes:
1. Annual Cost ofProduction
Raw material requirements (1,04,000 units x Rs. 80) Direct wages (1,04,000 units x Rs. 30)
Rs.
83.20.000
62.40.000 1,76,80,000
Rs.
3.20.000 60,000
1.20.000 5,00,000
Overheads (exclusive of depreciation)(1,04,000 x Rs. 60)
Work in progress Stock
Raw material requirements (4,000 units x Rs. 80)
Direct wages (50% x 4,000 units x Rs. 30)
Overheads (50% x 4,000 units x Rs. 60)
Raw material Stock
It is given that raw material in stock is average 4 weeks consumption. Since, the company is newly formed, the raw material requirement for production and work in progress will be issued and consumed during the year.
Rs. 86,40,000
x 4 weeks
Average 8 weeks 96,000 units
Rs. 200 Rs. 1,92,00,000 Rs.1,92,00,000
-x 8 weeks 52 weeks
i.e Rs. 29,53,846
Average 4 weeks Rs. 93,04,615
Rs.93.04.615 ,
-x 4 weeks
52 weeks
i.e Rs. 7,15,740
52 weeks i.e. Rs. 6,64,615 Finished Goods Stock
8,000 units @ Rs. 170 per unit = Rs. 13,60,000
Debtors for Sale
Credit allowed to debtors
Credit sales for year (52 weeks) i.e. (1,04,000 units-8,000 units)
Selling price per unit
Credit sales for the year (96,000 units x Rs. 200)
Debtors
Creditors for Raw material:
Credit allowed by suppliers Purchases during the year (52 weeks) i.e.
(Rs. 83,20,000 + Rs. 3,20,000 + Rs. 6,64,615) (Refer to Working notes 1,2 and 3 above) Creditors
|
Creditors for Wages Lag in payment of wages Direct wages for the year (52 weeks) i.e. (Rs. 31,20,000 + Rs. 60,000) (Refer to Working notes 1 and 2 above) Creditors |
Average 1 weeks Rs. 31,80,000 Rs.31,80,000 J -x 1 - weeks 52 weeks 2 |
12. (a) Traditional Phase and Modern Phase of Financial Management
During the Traditional Phase, financial management was considered necessary only during occasional events such as takeovers, mergers, expansion, liquidation, etc. Also, when taking financial decisions in the organisation, the needs of outsiders (investment bankers, people who lend money to the business and other such people) to the business was kept in mind.
Whereas, on the other hand, Modern Phase is still going on. The scope of financial management has greatly increased now. It is important to carry out financial analysis for a company. This analysis helps in decision-making. During this phase, many theories have been developed regarding efficient markets, capital budgeting, option pricing, valuation models and also in several other important fields in financial management.
(b) Liquidity Ratios and Activity Ratios
Liquidity or short-term solvency means ability of the business to pay its short-term liabilities. Inability to pay-off short-term liabilities affects its credibility as well as its credit rating. Continuous default on the part of the business leads to commercial bankruptcy. Eventually such commercial bankruptcy may lead to its sickness and dissolution. Short-term lenders and creditors of a business are very much interested to know its state of liquidity because of their financial stake. Therefore, liquidity ratios provide information about a company's ability to meet its short-term financial obligations.
Whereas, on the other hand, the activity ratios, also called the Turnover ratios or Performance ratios, are employed to evaluate the efficiency with which the firm manages and utilises its assets. These ratios usually indicate the frequency of sales with respect to its assets. These assets may be capital assets or working capital or average inventory. These ratios are usually calculated with reference to sales/cost of goods sold and are expressed in terms of rate or times.
(c) Debt Financing and Equity Financing
Financing a business through borrowing is cheaper than using equity. This is because:
Lenders require a lower rate of return than ordinary shareholders. Debt financial securities present a lower risk than shares for the finance providers because they have prior claims on annual income and liquidation.
A profitable business effectively pays less for debt capital than equity for another reason: the debt interest can be offset against pre-tax profits before the calculation of the corporate tax, thus reducing the tax paid.
Issuing and transaction costs associated with raising and servicing debt are generally less than for ordinary shares.
These are some of the benefits from financing a firm with debt. Still firms tend to avoid very high gearing levels. One reason is financial distress risk. This could be induced by the requirement to pay interest regardless of the cash flow of the business. If the firm goes through a rough period in its business activities it may have trouble paying its bondholders, bankers and other creditors their entitlement.
|
(d) Financial Lease and Operating Lease | |||||||||||||||||||||
|
The chief financial officer of an organisation plays an important role in the company's goals, policies, and financial success. His responsibilities include:
(i) Financial analysis and planning: Determining the proper amount of funds to employ in the firm, i.e. designating the size of the firm and its rate of growth.
(ii) Investment decisions: The efficient allocation of funds to specific assets.
(iii) Financing and capital structure decisions: Raising funds on favourable terms as possible, i.e., determining the composition of liabilities.
(iv) Management of financial resources (such as working capital).
(v) Risk management: Protecting assets.
(b) Composition of ROE using Du Pont
There are three components in the calculation of return on equity using the traditional DuPont model- the net profit margin, asset turnover, and the equity multiplier. By examining each input individually, the sources of a company's return on equity can be discovered and compared to its competitors.
(i) Net Profit Margin: The net profit margin is simply the after-tax profit a company generates for each rupee of revenue.
Net profit margin = Net Income + Revenue
Net profit margin is a safety cushion; the lower the margin, lesser the room for error.
(ii) Asset Turnover: The asset turnover ratio is a measure of how effectively a company converts its assets into sales. It is calculated as follows:
Asset Turnover = Revenue + Assets
The asset turnover ratio tends to be inversely related to the net profit margin; i.e., the higher the net profit margin, the lower the asset turnover.
(iii) Equity Multiplier: It is possible for a company with terrible sales and margins to take on excessive debt and artificially increase its return on equity. The equity multiplier, a measure of financial leverage, allows the investor to see what portion of the return on equity is the result of debt. The equity multiplier is calculated as follows:
Equity Multiplier = Assets + Shareholders' Equity.
Calculation of Return on Equity
To calculate the return on equity using the DuPont model, simply multiply the three components (net profit margin, asset turnover, and equity multiplier.)
Return on Equity = Net profit marginx Asset turnover x Equity multiplier
(c) Trading on Equity
The term trading on equity' is derived from the fact that debts are contracted and loans are raised mainly on the basis of equity capital. Those who provide debt have a limited share in the firm's earnings and hence want to be protected in terms of earnings and values represented by equity capital. Since fixed charges do not vary with the firms earnings before interest and tax, a magnified effect is produced on earnings per share. Whether the leverage is favourable in the sense increase in earnings per share more proportionately to the increased earnings before interest and tax depends on the profitability of investment proposals. If the rate of return on investment exceeds their explicit cost financial leverage is said to be positive.
In other words, it can be stated that trading on equity means using borrowed funds to generate returns in anticipation that the return would be more than the interest paid on those funds. Therefore, trading on equity occurs when a company uses bonds, preference shares or any other type of debt to increase its earnings on equity shares. For example, a company may use long term debt to purchase assets that are expected to generate earnings more than the interest on the debt. The earnings in excess of the interest on the debt will increase the earnings of the company's equity shareholders. This increase in earnings indicates that the company was successful in trading on equity.
(d) External Commercial Borrowings (ECBs)
External Commercial Borrowings (ECBs) refer to commercial loans (in the form of bank loans, buyers credit, suppliers credit, securitised instruments ( e.g. floating rate notes and fixed rate bonds) availed from non-resident lenders with minimum average maturity of 3 years. Borrowers can raise ECBs through internationally recognised sources like (i) international banks, (ii) international capital markets, (iii) multilateral financial institutions such as the IFC, ADB etc, (iv) export credit agencies, (v) suppliers of equipment, (vi) foreign collaborators and (vii) foreign equity holders.
External Commercial Borrowings can be accessed under two routes viz (i) Automatic route and (ii) Approval route. Under the Automatic route there is no need to take the RBI/Government approval whereas such approval is necessary under the Approval route. Company's registered under the Companies Act and NGOs engaged in micro finance activities are eligible for the Automatic Route whereas Financial Institutions and Banks dealing exclusively in infrastructure or export finance and the ones which had participated in the textile and steel sector restructuring packages as approved by the government are required to take the Approval Route.
139
Note: The number of days in a year has been assumed to be 360 days.
(b) (i) Estimate of the Requirement of Working Capital
Rs. Rs.
|
Attachment: |
| Earning: Approval pending. |