Annamalai University 2007 B.A Economics 640 STATISTICS - Question Paper
ANNAMALAI UNIVERSITY
B.A. DEGREE EXAMINATION, 2007
ECONOMICS
640. ECONOMICS STATISTICS
Register Number:
Name of the Candidate :
7 0 5 0 B.A. DEGREE EXAMINATION, 2007
(ECONOMICS)
(SECOND YEAR)
(PART - III)
( PAPER - IV )
( Ancillary )
(Including Lateral Entry )
May ] [ Time : 3 Hours
Maximum : 100 Marks
Answer any FIVE questions.
All questions carry equal marks.
1. Define statistics and describe the importance of statistics for economic analysis and planning.
2. Bring out the differences between primary and secondary data and explain the requisites of a good questionnaire.
3. Distinguish between classification and tabulation of data and explain the essential parts of a statistical table.
4. Explain the rules for construction of diagrams and illustrate how line and bar diagram has to be drawn ?
5. Explain the properties of arithmetic mean and calculate arithmetic mean for the following data:
|
X |
Y |
|
100 - 120 |
10 |
|
120 - 140 |
8 |
|
140 - 160 |
4 |
|
160 - 180 |
4 |
|
180 -200 |
3 |
|
200 - 220 |
1 |
|
220 - 240 |
2 |
8. U 6WJT L| 6 Srfl SST <3 & IT 6 6OT 6 . - 6U 6OT IJ 111 p . U SOT5T L| (SITffiSOTffi M6TTSJI@ (Lp6OTIDB6?n6TTlL|Lb eJl6TT6(3j.
9. <Ra(oliD@i5B6b " 6U6?nrriup. ,?ld6ij[TiLiljl| sii(oliD@ssssayissT
U6\)(o6Up (Lp6OTIDB6?n6TTlL|Lb MSSSST J56ST6OTLD66?n6TTlL|Lb SlilSLlrfl.
10. g)rf3llUITsJl6b, sJIsLismussffjsroiD i_|6tt6tFI sJl6urriijB6TflssT Ulij<fi6?n6ST SlilSLlrfl.
6. #lsSID6b 6TT6OT61JB(6rF|ffi(5Lb (SfB IT L 1_ aSI lt)(3jLb 2_6TT6TT (S6UpUrT@B6?n6TT eJl6TT6(3j. |jD(olBrT@ffiBLJUll@6iT6TT L_|6TT6rfl Slil61JraB(6rF|ffi(5 <EBITIT 6\) ijllUITSrUffijflSST (S<EBITL1_B (olB(LgsJl6OTSi5T 66WJT6<fi@.
7. |jD(olBrT@ffiBLJUll@6iT6TT L_|6TT6rfl 6l51 6UIJ r5J 6 (6TF> 6 0 , 2_I_6ST (olSSni_ITL|ffi (olB(LgsJl6OTSi5T 66WJT6<fi@.
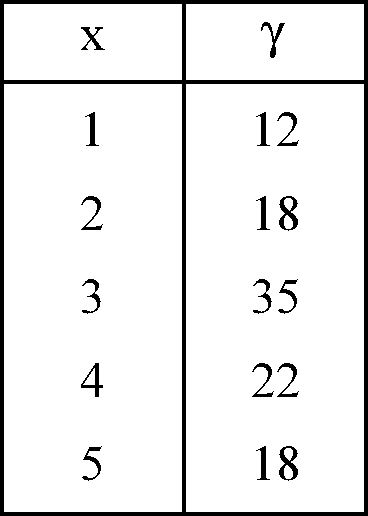
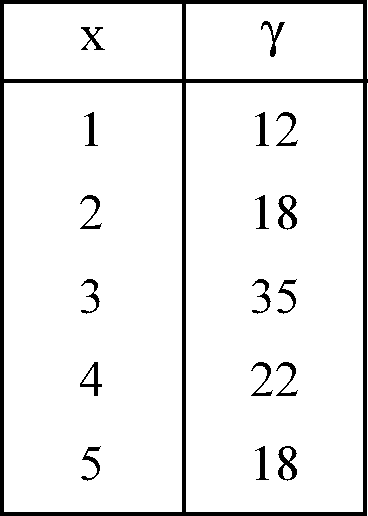
6. Bring out the differences between dispersion and skewness. Calculate Karl Pearsons co-efficient of skewness for the following :
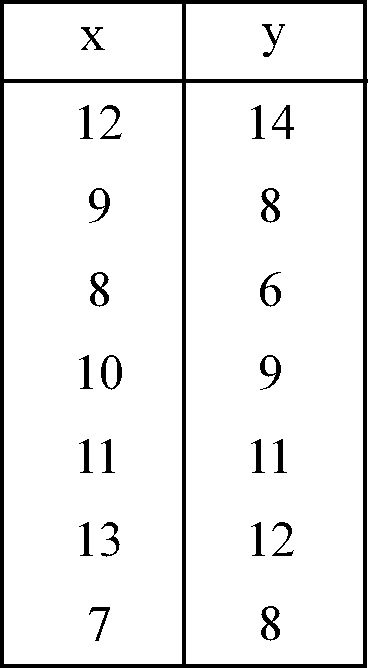
7. Calculate the correlation co-efficient for the following data:
|
X |
y |
|
12 |
14 |
|
9 |
8 |
|
8 |
6 |
|
10 |
9 |
|
11 |
11 |
|
13 |
12 |
|
7 |
8 |
8. Define the term association of attributes and explain how it is measured.
9. Define sampling and explain the different types of random sampling with its advantages.
10. Explain the role of agricultural statistics in India.
u5lLpn aa ld
6j(l56pLb gjjigd 6lilsOTrTffiB(6fF|B(5 sJl6OTI_ 5(TF,6. 6556BTgJ 6lilsOTrTffiB(6fF|B(5Lb ffLD LDJlj(olU6WJT66rT.
1. L| 6TT Srfl 111 6OT 60 6U 6OT tj 111 p . (ol U IT 0 6TT IT g IT IJ
llieJI ri)(3jLb 1 ll l_ LSI @ S3 g)J B 0 LD L| 6TT 6rfl u51 ILI 6lfl 6ST (LpaxSiussffjsusslsrosijr 6T(j_gigj.
2. (J-P S) 6\) rf} 6CD 60 LDJTjpLD, tj 6WJT 1_ IT LD rf} SOT 60
(S6UpUrT@B6?n6TT 6jl6TT6(3j6.
3. 61J6OT6UU@<6(3jl_b Ll_6jJ6TO6UUfflR.KffllffifgSl_b )6?ni_(SlUlL|6rT6TT <3 6U P U (T ll Lq_ 6tr> 6ST 6lil6TTB(3j. 6J (IP)
ll L_ 6U 6OT SOT5T ll51 6ST (Lp 6 <fi 111 LD IT 6ST LD B- r5J 6 6OT 6TT 6lil6TTB(3j.
4. 6U sm rr u i_ roj 6 6tt sli sm rr sli &> p (3j a_ scbT i_ n sst 6l51 (J-P 6CD jD6 6CD6TT il 6TT 6 (3j 6. (SfBIT 6U6OTIJ U 1_ (Lp LD, Ull6OTI_ 6l51 6TT 6 6 LJ U 1_ r5J 6 (6TF> LD , 6U 6OT rr 111 LJ U @ 6U g SST (LP6OTJD6OTIU Slil6TTffiBUUI_raB(6rF|l_SST SlSlsUlfl.
5. <Ra ll @ B rr (T B rfl u51 SST LD B roj 6 6OT 6TT eJl6TT6(3j. <S|jD (ol 6 (T @ 6 6 LJ U ll @ 6TT 6TT L| 6TT Srfl Slil 6U rr r5J B (6TF> 6 0 , aailQsrrrTsrfl Bs;jsT@ijlLq_BB6i|Lb :
|
X |
Y |
|
100 - 120 |
10 |
|
120 - 140 |
8 |
|
140 - 160 |
4 |
|
160 - 180 |
4 |
|
180 -200 |
3 |
|
200 - 220 |
1 |
|
220 - 240 |
2 |
Turn over
|
Attachment: |
| Earning: Approval pending. |