Annamalai University 2007 B.A Economics STATISTICS - university paper
Register Number:
Name of the Candidate :
7 0 5 0 B.A. DEGREE EXAMINATION, 2007
(ECONOMICS)
(SECOND YEAR)
(PART - III)
( PAPER - IV )
( Ancillary )
(Including Lateral Entry )
May ] [ Time : 3 Hours
Maximum : 100 Marks
Answer any FIVE questions.
All questions carry equal marks.
1. Define statistics and describe the importance of statistics for economic analysis and planning.
2. Bring out the differences between primary and secondary data and explain the requisites of a good questionnaire.
3. Distinguish between classification and tabulation of data and explain the essential parts of a statistical table.
4. Explain the rules for construction of diagrams and illustrate how line and bar diagram has to be drawn ?
5. Explain the properties of arithmetic mean and calculate arithmetic mean for the following data:
|
X |
Y |
|
100 - 120 |
10 |
|
120 - 140 |
8 |
|
140 - 160 |
4 |
|
160 - 180 |
4 |
|
180 -200 |
3 |
|
200 - 220 |
1 |
|
220 - 240 |
2 |
8. U SWJT L| B 6fi SST <3 S1 IT 6 6OT 6 . - 6D 6OT I UJ p . U SWJT L| SlTffiSOTffi M6TTS11@ (Lp6OTIDB6ro6TTlL|Lb il6TT6(3j.
9. a. Gin) as 5 ) - 6U6rorriup. sldsuitiLiljli sb.G1iD@sssa5issT
U6b(S6Up (Lp6OTIDB6ro6TTlL|Lb MSSSST JT3SST6roLDB6OT6TTlL|Lb
siSlsuifl.
10. g)rf3llUITSl6b, 611 SUSDIT LU SSffJSOTlD I_|6TT6tFI Sli6UrriJB6TfSST ul6ros0T siSlsurfl.
6. ISSJD6) 6TT6OT61JB(6rF|ffi(5Lb (SB IT L 1_ sl lt)(3jLb 2_6TT6TT <36UpUrT@B6OT6TT 16TT 6 (3j. |jD(olBrT@.BLJUll@6iT6TT L_|6TT6rf 61jp6(OTF>>(3j TIT 6\) LllUITSrUSjflSST (SffirTLLffi (olB(LSli6roS0T 66WJT6<S@.
7. |jD(olBrT@.BLJUll@6iT6TT L_|6TT6rf SlSl 6U J rJ 6 (6TF> 6 (3j , 2_I_6ST (olSSrTI_ITL|ffi (olB(LSli6roS0T 66WJT6<S@.
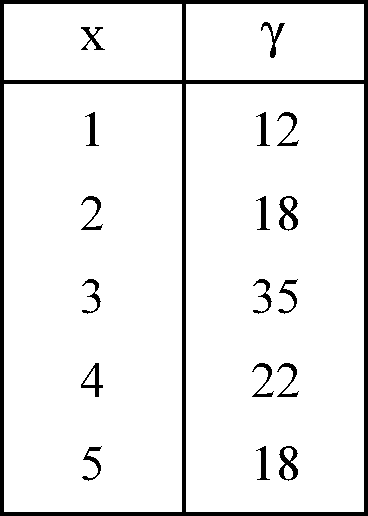
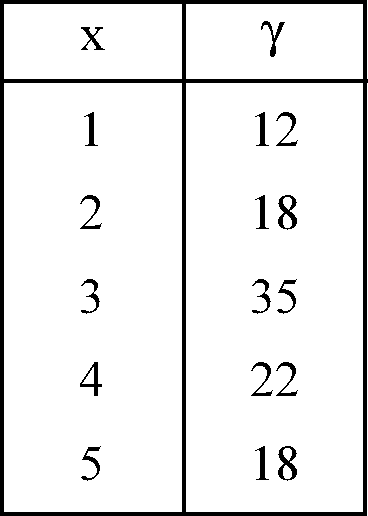
6. Bring out the differences between dispersion and skewness. Calculate Karl Pearsons co-efficient of skewness for the following :
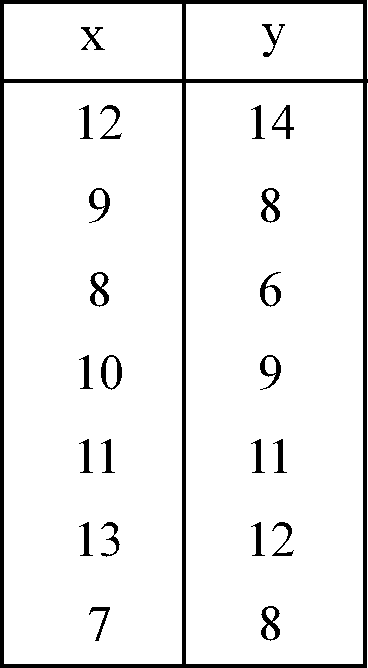
7. Calculate the correlation co-efficient for the following data:
|
X |
y |
|
12 |
14 |
|
9 |
8 |
|
8 |
6 |
|
10 |
9 |
|
11 |
11 |
|
13 |
12 |
|
7 |
8 |
8. Define the term association of attributes and explain how it is measured.
9. Define sampling and explain the different types of random sampling with its advantages.
10. Explain the role of agricultural statistics in India.
&,i6\ipn a,a>ib
6J<356pLD 6lilsOTrTffiB(6fF|ffi(5 6lil6OTL_ 5(TF,6.
6lilsOTrTffiB(6fF|ffi(5Lb B- LO LDiU(olLJ6WJT66rT.
1. L| 6TT Srfl 111 6OT 60 6U 6OT tj 111 p . (ol U (T 0 6TT (T ff, (T IJ
lusiil it)(5Lb i il i_ l61 @ 5 6] ffi (5 ld l_| 6tt srfl uil tu ail sst (Lpa.fiiussffjsusslsrosijr 6T(LggiJ.
2. (Lp SS 6U rf} SOT 60 LDJTjpLD, g) tj 6WJT 1_ (T LD rf} SOT 60
L| 6TT erfl siil 6U rr roj a (ctf, a (5 g) 6ot i_ <3 tu u_| 6tt 6tt
(S6UpUrT@66OT6iT 6lil6iT6(3j6.
3. 61J6OT6ULJ@66(3jLb LL6U6ro6UUfflg60lffiig,Lb )6?ni_(SiuiL|6rT6rT <36upurnlLq_6OT6ST 6iil 6tt a (3j. 6J(tf,
ll 1_ 6U 6OT 6WJT uil 6ST (Lp 6 <fi 111 LD (T 6ST LD B- r5J 6 6OT 6TT
6lil6iT6(3j.
4. 6U sm rr u i_ roj a 6tt sli sm rr sli 5 p (3j a_ 6wjt i_ rr 6st
Slill(Lp6?niDB6?n6TT il 6TT 6 (3j 6. (SffiiT 6U6OTIJ U 1_(Lp LD, Ull6OTI_ il 6TT 6 6 LJ U 1_ r5J 6 (6TF> LD , 6U 6OT tj ILILJ U @ 6U g SST (Lp6OTID6?niU Slil6TTffiBUUI_raB(6rF|l_SST siilsurfl.
5. <Ra il@b-rr rrb- rfluilsst ldb- roj66?n6tt ail 6tt a (3j. byD
(ol 6 (T @ 6 6 LJ U ll @ 6TT 6TT L| 6TT 6rfl Slil 6U rr r5J 6 (6TF> 6 (5 , siiilQsrrrTsrfl 66@L5lLq_666i|Lb :
|
X |
Y |
|
100 - 120 |
10 |
|
120 - 140 |
8 |
|
140 - 160 |
4 |
|
160 - 180 |
4 |
|
180 -200 |
3 |
|
200 - 220 |
1 |
|
220 - 240 |
2 |
Turn over
|
Attachment: |
| Earning: Approval pending. |