Annamalai University 2007 B.A Economics 640 " Economic Statistics " Part II IV - Question Paper
4
2. (Lp56brf}s?na) LDitjpLb, rj sout i_ n i> i_|6rr6rf1 Sl5l61JraB(6rF|B(5 )6?ni_(SlUlL|6iT6TT <3 6U p U (T @ 6 6OT 6TT 6l5l6TTB<S, (LpeS6l) L_|6TT6rfl SlSl 6U tj r5J 6 6OT 6TT <3 B- 6 rfl 6 0 LD (Lp 6OT IT) 6 6OT 6TT ,5M g SST rf} SOT JD , (56OTJI)6(6rF|l_6ST 5l6TT60.
3. ,5M6?n60(ol6U6WJT Urj6U6i) 6U6OTrjlUp. ,5M6?n60(ol6U6WJT urr6ua5l6b, lSI rfl sx| 6T 6b 6tr> a) 6tr> tu 6tr> ld a. (5 ld (Lp6OTIDB6?n6TT Sl5l6Urfl.
4. 6U6?nrrUI_rijB6iT LDitjpLb, 5l6TT66UUI_rij66iT (M_P60LD L_|6TT6rfl SlSl 6U tj r5J 6 6OT 6TT (ol 6U 6rfl LJ U @ ig ffj 6U g 6ST (T 6U S_SObTI_IT(L) UlUSSTB6OT6TTlL|Lb 06 n)B6?n6TTlL|Lb Sl5l6Urfl. (otEBrr (T) 6U6?nrrui_Lb 6u6?nrr6ussii)(5 s_ scut i_ n sot sJII (Lp6OTIDB6?n6TTlL|Lb 5l6TT606.
5. sb.ll erjnerfl, g)6roi_rf5s?n6U LDitjpLb, (Lpffi 516ttB0. <|jD (olBn@BBLJUll@6iT6TT L_|6TT6rfl SlSl 6U tj r5J 6 (6TF> 6 sb.ll srrnsrfl 66WJT@L5lLq_ffi66i|Lb :
|
X |
1 |
2 |
3 |
4 |
5 |
6 |
7 |
8 |
9 |
10 |
|
y |
45 |
49 |
51 |
53 |
57 |
62 |
71 |
64 |
78 |
80 |
Name of the Candidate :
4 0 3 4 B.A. DEGREE EXAMINATION, 2007
(ECONOMICS)
(SECOND YEAR)
(PART-III)
(PAPER-IV)
( Ancillary )
(Including Lateral Entry)
December ] [ Time : 3 Hours
Maximum : 100 Marks
Answer any FIVE questions.
All questions carry equal marks.
1. Define statistics. Explain its functions, its uses and its limitations.
2. Distinguish between primary and secondary data and explain the different methods of collecting primary data with its merits and demerits.
3. Define frequency distribution and explain different methods of constructing class intervals.
4. Summarise the advantages and disadvantages of diagrammatic and graphic presentation of data and explain the rules to construct line graph.
5. Explain the term mean, median and mode and calculate the arithmetic mean for the following data:
|
X |
l |
2 |
3 |
4 |
5 |
6 |
7 |
8 |
9 |
10 |
|
y |
45 |
49 |
51 |
53 |
57 |
62 |
71 |
64 |
78 |
80 |
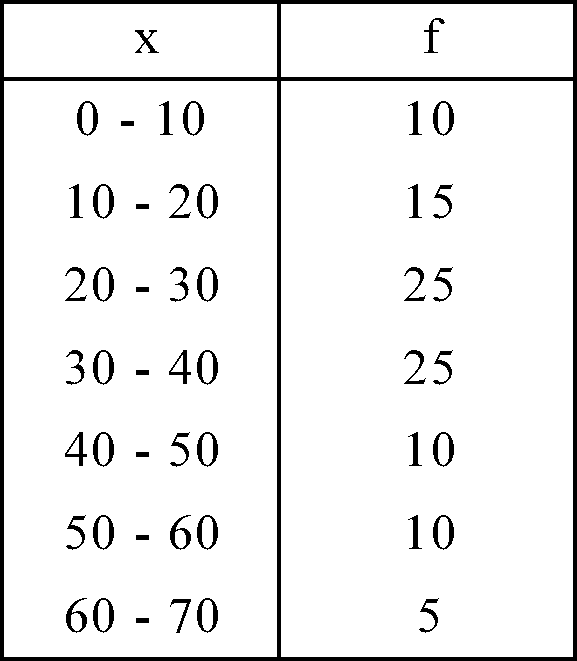
6. What is meant by dispersion? Calculate the standard deviation for the following data:
7. Define the term correlation and calculate the correlation co-efficient for the following data:
|
X |
23 |
27 |
28 |
29 |
30 |
31 |
33 |
35 |
36 |
39 |
|
y |
18 |
22 |
23 |
24 |
25 |
26 |
28 |
29 |
30 |
32 |
8. Explain the conditions for testing the consistency of data and find out whether the following data is consistent.
(AB) = 35, (B) = 65, (A) = 55, N = 100.
9. What is meant by sampling? Explain different methods of sampling.
10. Explain the role of statistics in conducting population census.
&,i6\ipn a,a>\b
6J<356pLD fgjiid 6l51sOTrTffiB(6fF|B(5 Sl5l6OTI_ 5(TF,6. 6556BTgJ 6l51sOTrTffiB(6fF|B(5Lb ffLD Ln;U(olU6WJT66iT.
1. L|6TT 6rfllLI6D60 6U6OTrjlUp, MSSSST Gl,? W6UUnLLq_6?n6STlL|Lb
(jffi<fiwSSffJ61JS6OT60TlL|Lb SOT JDUrT@B6?n6TTlL|Lb siSlsurfl.
8. qOT l<rjp<<OT
OTdh- gp
QsiauuL@OTOT qOT l<rjp<<OT 5"dfLm.
(AB) a 35, (B) a 65, (A) = 55, N = 100.
9. feQp@M ? feQp@M otot uSaip sot rndh.
10. mdffiOT Qad swdQeguJ, qOT l<rjp<<OT uPfOT lairfl.
|
7. l<ot QnLiiq gp Qffiff@dffiuuL@OTOT X |
23 |
27 |
28 |
29 |
30 |
31 |
33 |
35 |
36 |
39 |
|
y |
18 |
22 |
23 |
24 |
25 |
26 |
28 |
29 |
30 |
32 |
Turn over
|
Attachment: |
| Earning: Approval pending. |